Program signals are a mechanism for applicants to express their genuine interest in a program at the time of application. They are designed for programs to use, as one of many data points, in deciding whom to invite for interview.
There are three approaches to program signaling being used by specialties in residency selection, each with different goals and pros and cons.
| Small Signal | Large Signal | Two-Tier Signal | |
|---|---|---|---|
| Goal |
|
|
|
| Pros |
|
|
|
| Cons |
|
|
|
Using program signal and application data drawn in October 2023, the AAMC is beginning to see how the different approaches to signaling are starting to play out.
Applicants Use of Signals
Most applicants used the maximum number of available signals in their specialties regardless of signaling approach.
There were no differences in the number of signals sent by applicant race/ethnicity and gender.
On average, IMG and DO applicants sent fewer signals than their MD peers in Large Signal specialties and fewer silver signals in Two-Tier specialties. However, this can be largely explained by the fact that they also applied to fewer programs in these specialties.
Signals and Application Volume
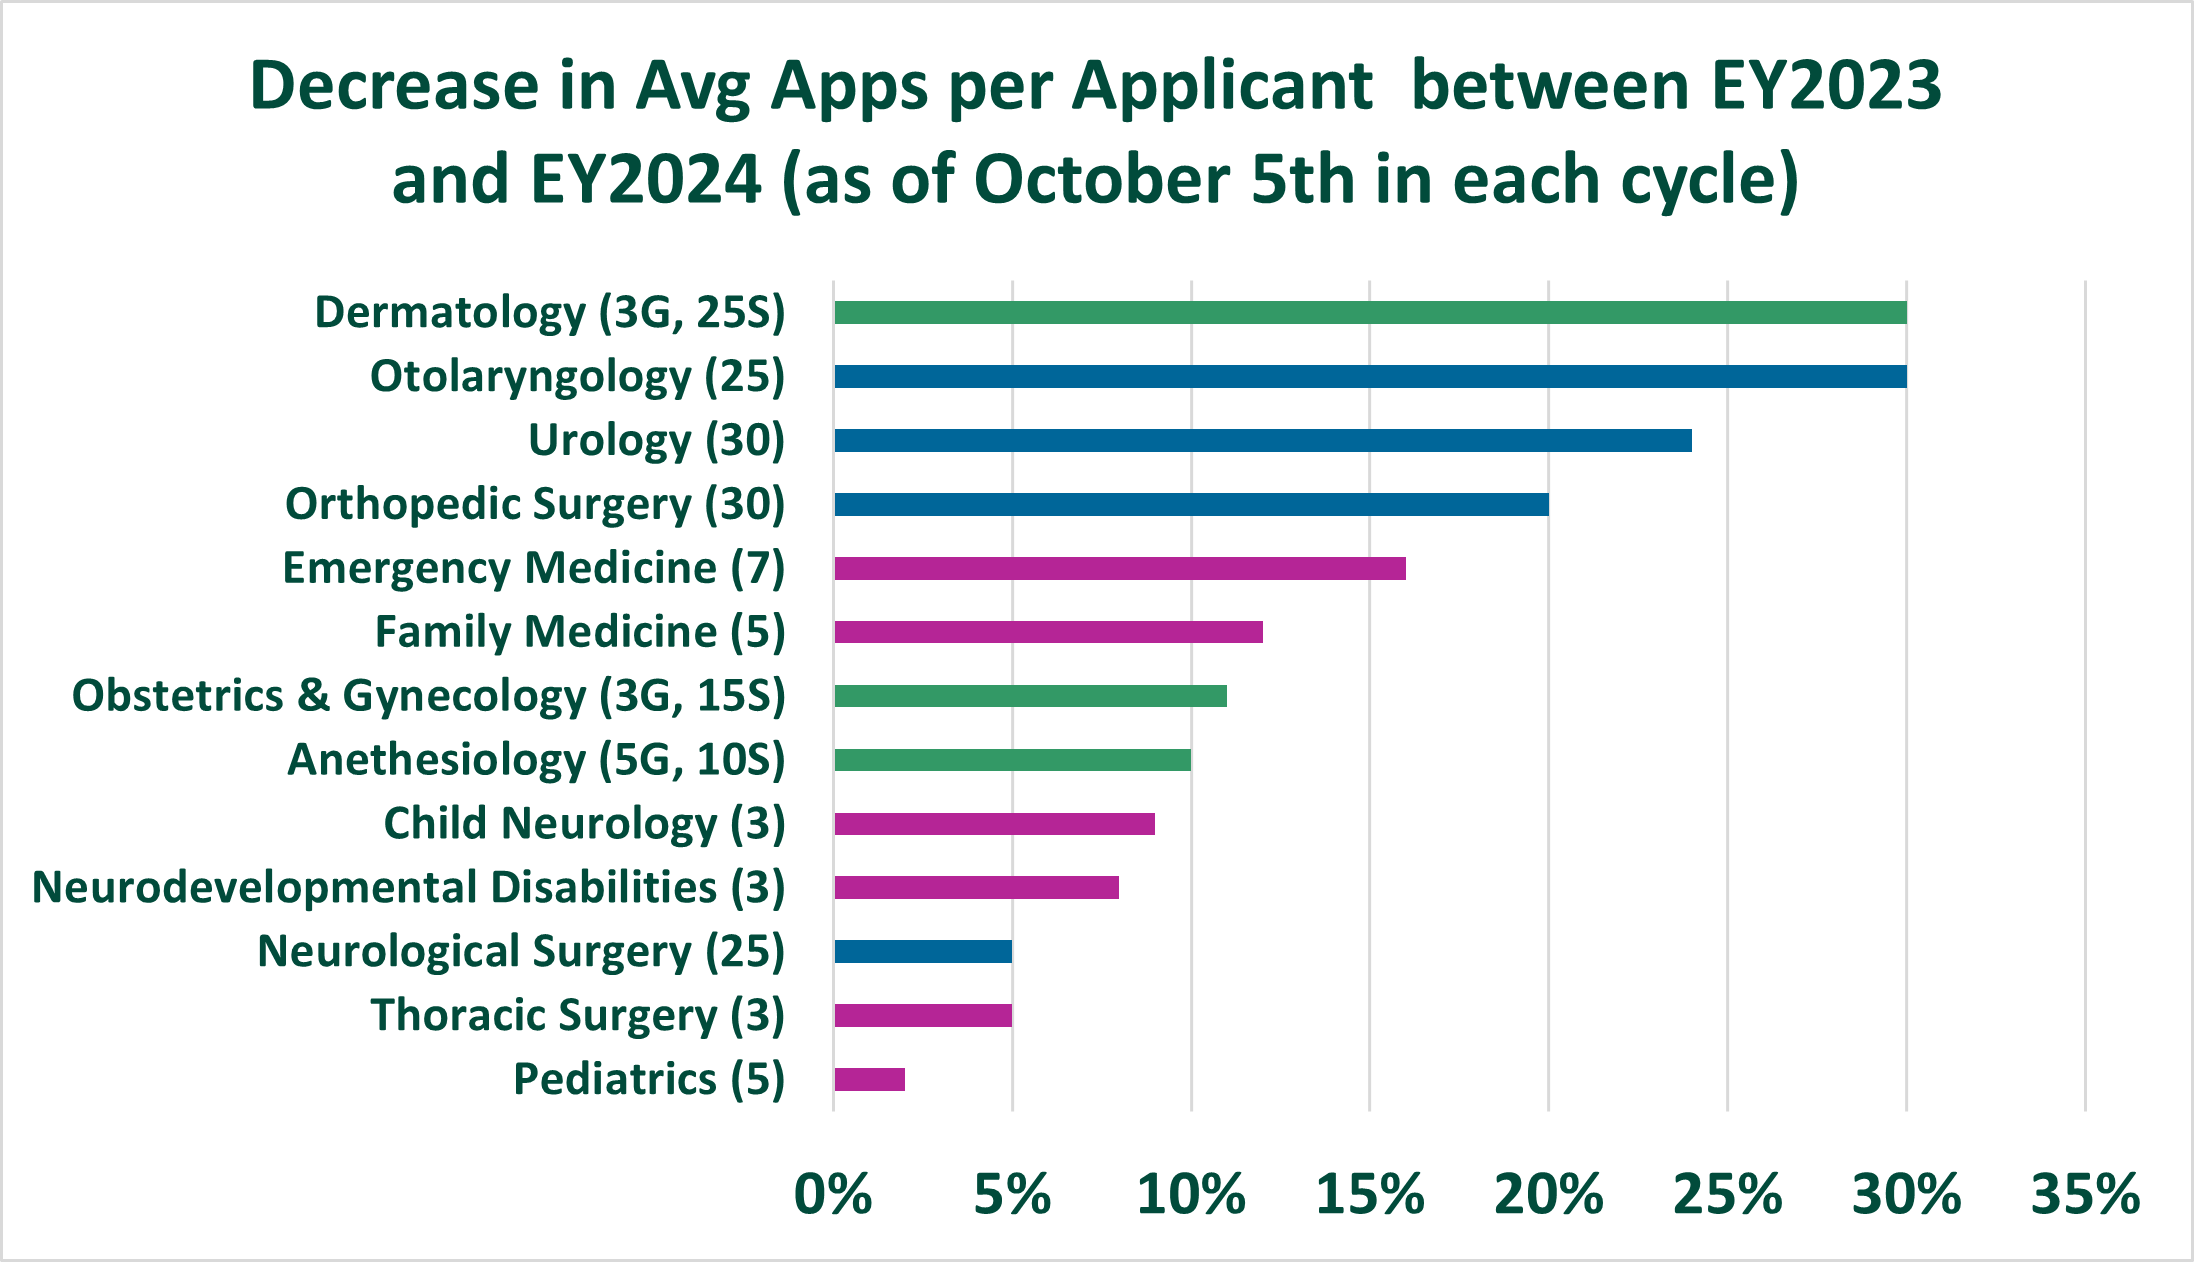
The total drop in the average number of applications for many specialties that participated in signaling is especially notable. Over the past few years, the AAMC, medical school advisors, student leaders, program directors, specialty organizations, and others in the House of Medicine have been emphasizing the need to apply to fewer programs.
Overall, Large Signal and Two-Tier specialties observed the largest drops in average applications per applicant and average applications received per program. However, there were substantial drops in some Small Signal specialties too. It’s important to note that the observed drops are being driven largely by changes in MD and DO applicant behavior. IMG applications continued to rise gradually, which may explain why larger overall drops are observed in Large Signal and some Two-Tier specialties which have lower concentrations of IMGs.
It’s too soon to attribute these changes to signaling approach alone. More data and research are needed to understand whether this drop will continue and better understand the potential root cause(s).
Signal Concentration
For the third year in a row, we’ve observed that signals are not uniformly distributed across programs. Just as some programs receive more applications, some also receive more signals. This can mean that programs may use signals differently given the proportion of them in their applicant pool.
Small Signal specialties continue to see higher concentrations of signals in a smaller number of programs. This year, an average of 24% of signals were sent to 10% of programs in Small Signal specialties, compared to Large Signal specialties where an average of 18% of signals were sent to 10% of programs. Large Signal specialties succeeded in distributing signals more widely. Specialties utilizing a two-tier approach may be getting the best of both worlds. While gold signals are concentrated in a smaller number of programs (22% of signals were sent to 10% of programs), silver signals were more widely distributed across programs (18% of signals were sent to 10% of programs). A small concentration of gold signals and wider distribution of silver signals may better reflect applicants’ true preferences and give applicants and programs greater flexibility.
Implications for Signal to Interview Invitation Conversion
At this point in the cycle, we don’t have much information about signal to interview conversion. But we have some hints as to how this may play out based on the percentage of applicants who signaled in each program. Programs that receive signals from many of their applicants or from more than they typically interview may be tempted to use signals as a requirement for interview invitation.
As shown in the chart below, the average percentage of applicants who signaled varied by specialty. As expected, the percentage of applicants who signaled is largest in Large Signal specialties (average of 47% of all applicants signaling a program in Orthopedics and 40% in Otolaryngology) and Two-Tier specialties (average of 45% in Dermatology and 25% in OBGYN). Compare that to Small Signal specialties, such as Pediatrics (average of 10% of all applicants signaling a program) or Emergency Medicine (average of 13% of all applicants signaling a program).
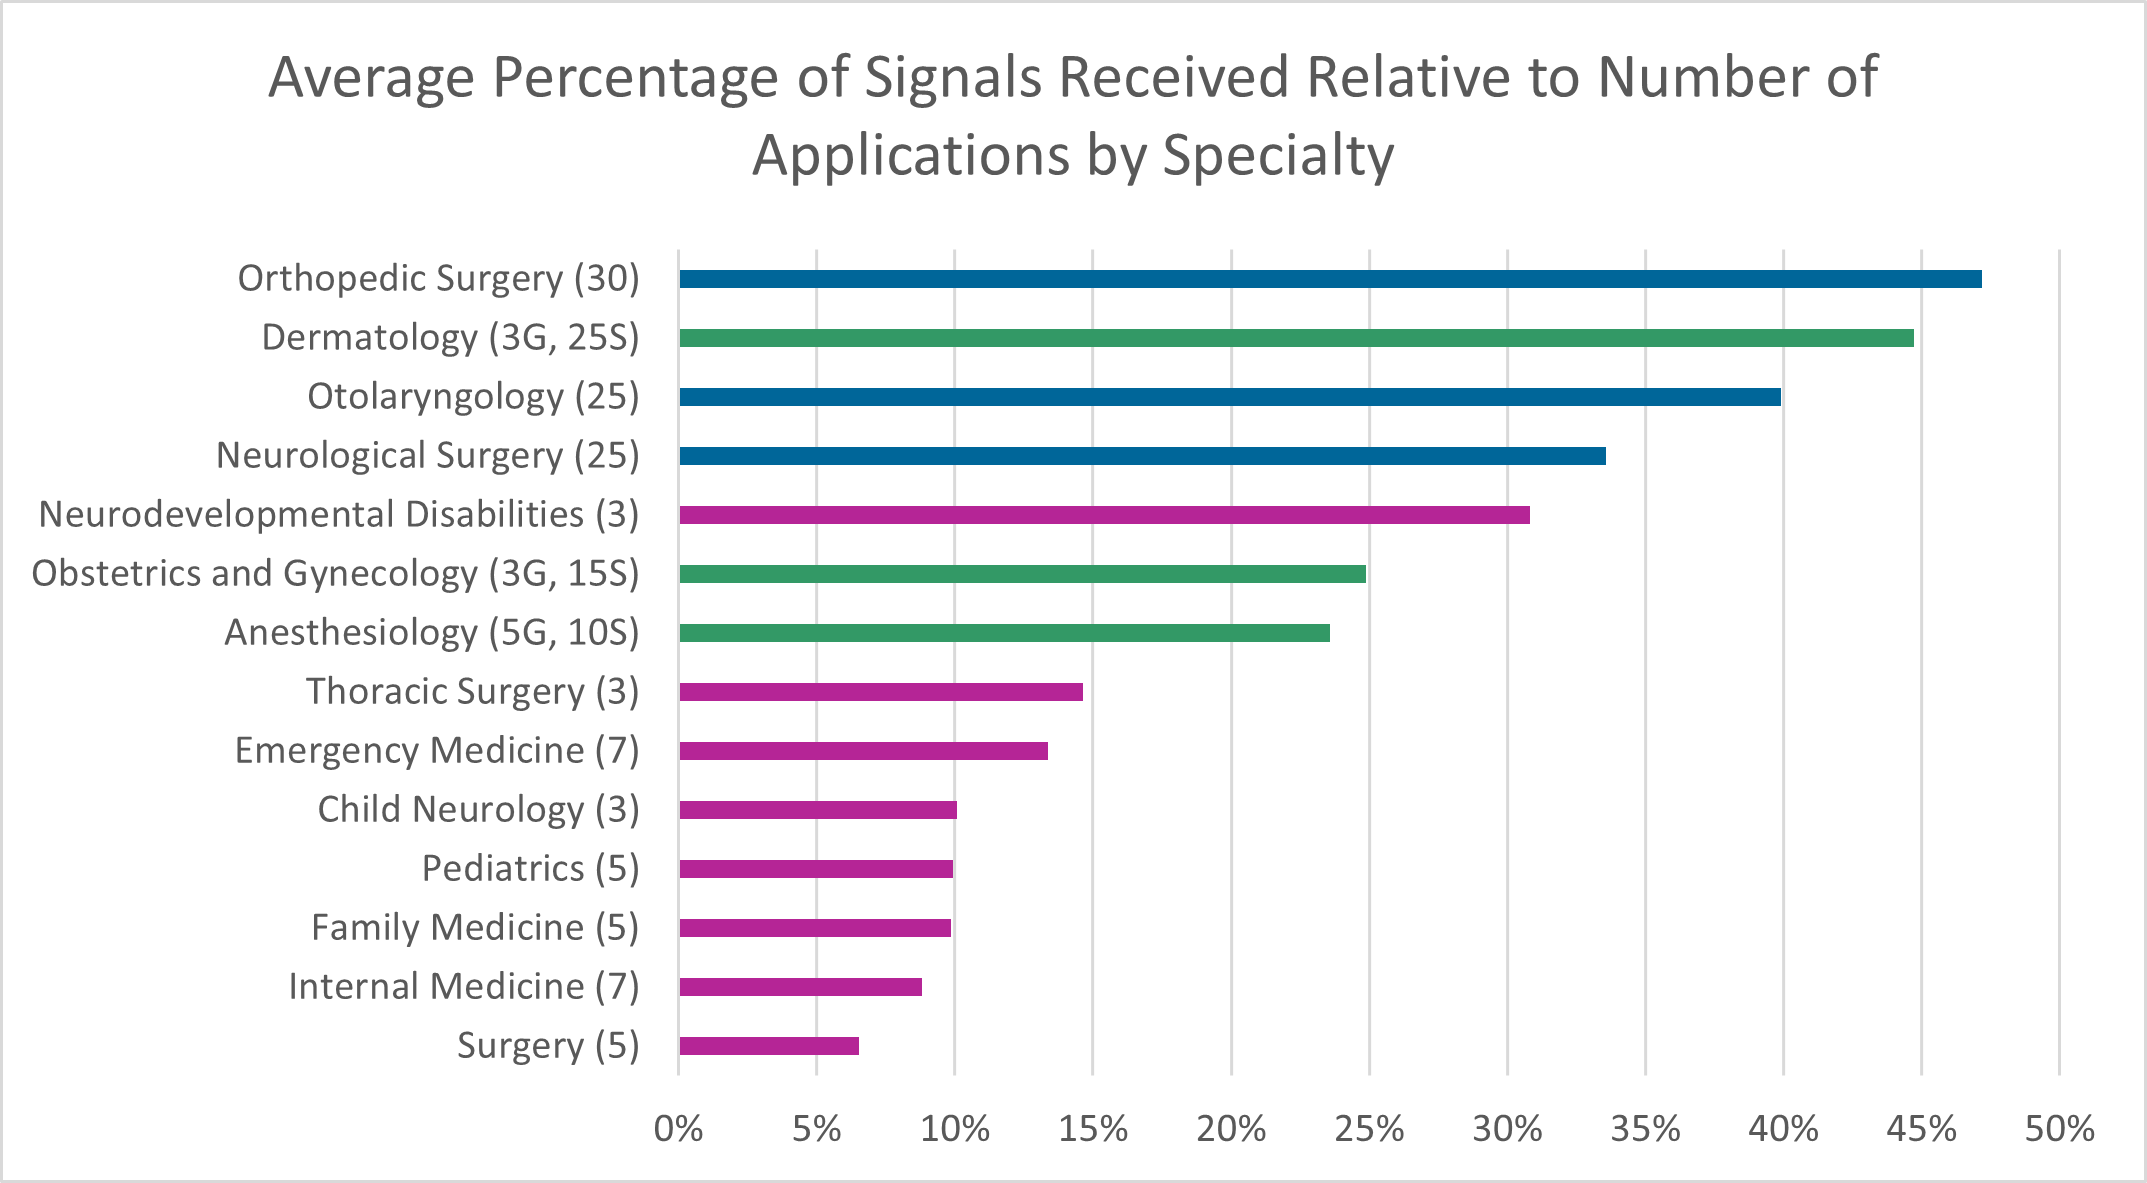
We predict that the signal to interview conversion rates will be high across the board in the 2024 ERAS cycle and especially high for those specialties and programs with a higher percentage of applicants who signaled their program. This is because program directors won’t need to look beyond those who signaled to fill their interview spots.
You can learn more about these specialty-level program signal data and more on the ERAS Statistics page.
Get more information about the relationship between program signals and interview invitations by reviewing Exploring the Relationship Between Program Signaling and Interview Invitations Across Specialties (PDF with speaker notes). Our collaboration with Thalamus provides opportunities to provide better insights, data, and reports for students, advisors, and programs.