Physician scientists, MDs and DOs with or without additional degrees who are engaged in research, are a key component of the research enterprise, receiving a substantial share of major awards for biomedical research.1 While today’s medical students and residents are increasingly interested in pursuing research,2 there are longstanding concerns about the future of the physician-scientist workforce, which is aging overall and makes up an ever-shrinking share of both the research and physician workforces,1-3 a pressing concern given physician scientists’ critical role bridging the gap between research and clinical practice.
In 2022, AAMC conducted the second round of the National Sample Survey of Physicians (NSSP), which recruited a national sample of 5,917 physicians in the United States, both within and outside of academic medicine. The survey, which was first fielded in 2019, covered a comprehensive set of topics, including physician demographics, academic affiliations, work schedules, and physician well-being. Critically, the survey also included questions about physicians’ engagement in research4.
This data brief uses the 2022 NSSP data to describe the demographic characteristics of physicians conducting research (physician scientists5) and compares this subgroup of physicians to their physician peers who are not engaged in research. It highlights similarities that physician scientists share with the broader physician workforce and some ways in which their experiences diverge. Throughout, analytic weights were applied to approximate a nationally representative sample of U.S.-based physicians along the lines of gender, specialty, and age, and chi-square tests and t-tests were used to determine if observed differences were statistically significant at the 95% confidence level.
Research involvement among physicians
Overall engagement in research
Fourteen percent of respondents were engaged in research, and it was more common for physicians who had an academic affiliation to be engaged in research than their peers outside of academic medicine (Figure 1): only 8% of nonacademic physicians were engaged in research, while 24% of academically affiliated physicians were, a statistically significant difference at the 95% confidence level. As a result, most physician scientists (62%) were affiliated with an academic institution.
Only 4% of respondents held a PhD in addition to their medical degree. Of those, 33% were engaged in research (in comparison, 13% of physicians without a PhD were engaged in research), a statistically significant difference. Since so few physicians held a PhD, however, most of the physician-scientist workforce (91%) did not have a PhD.
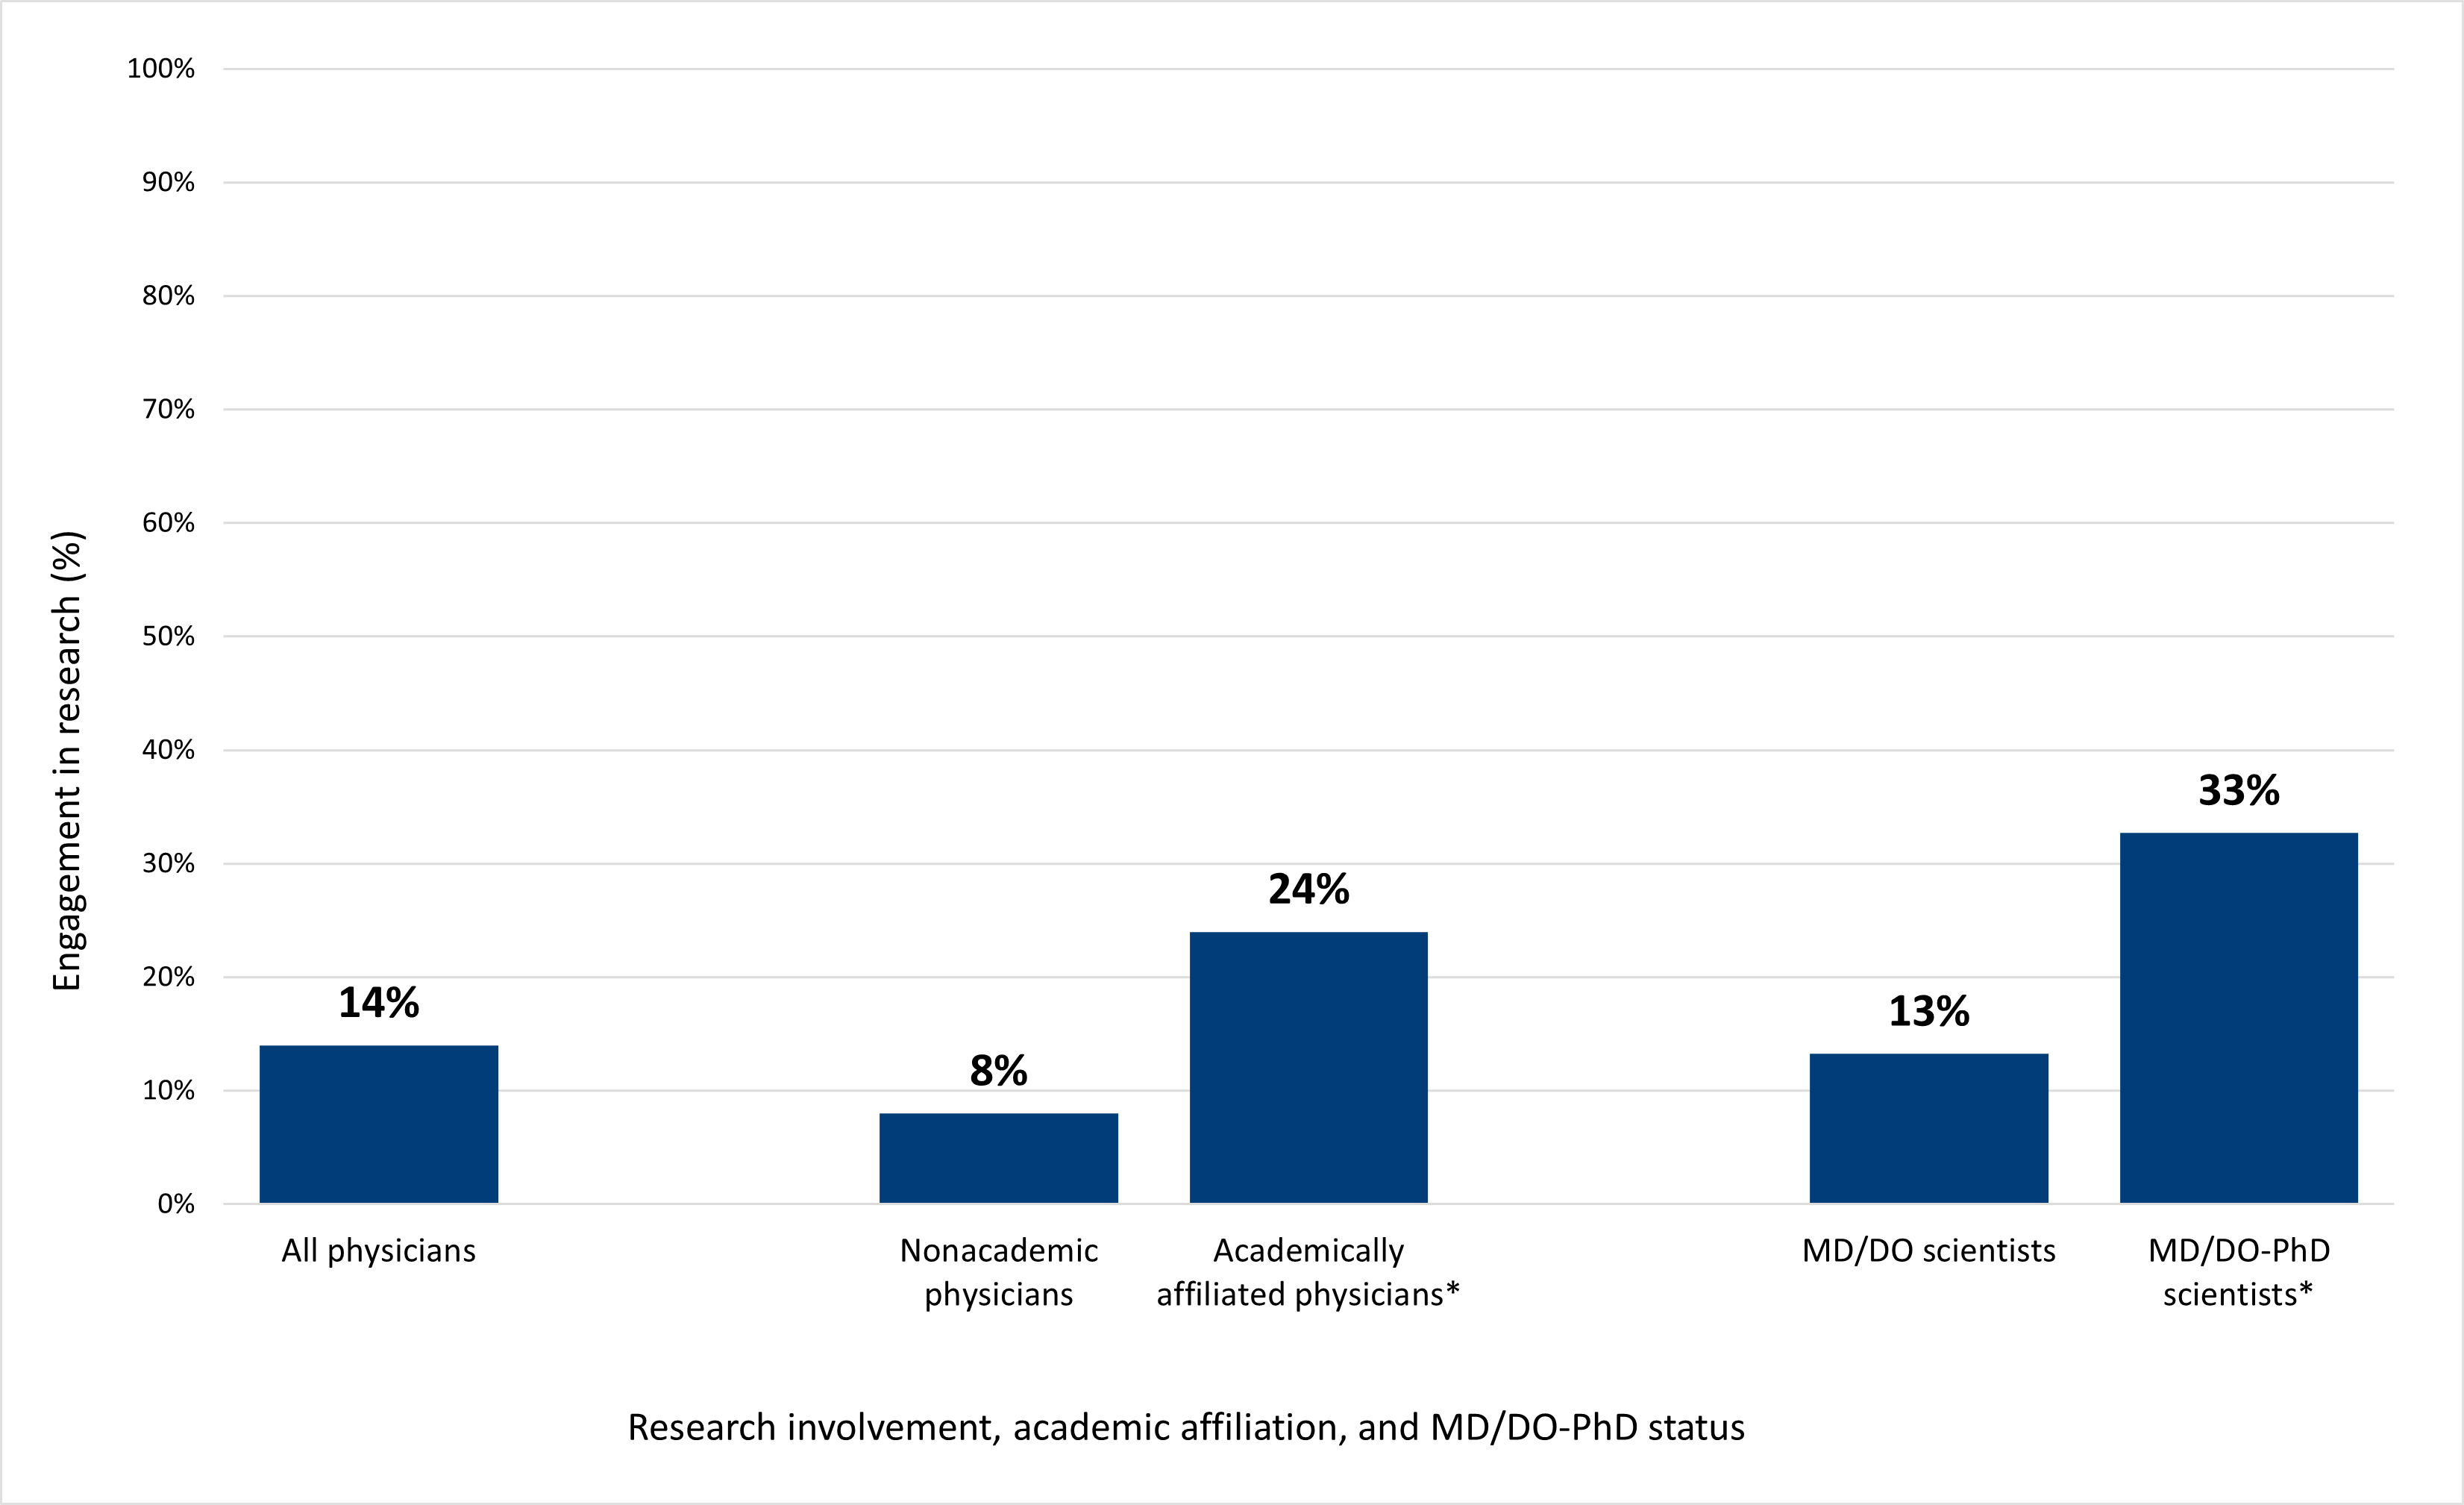
Figure 1. Engagement in research is more common among academically affiliated physicians than physicians outside of academic medicine.
Note: Asterisks (*) denote a statistically significant difference at the 95% confidence level between the percent of nonacademic and academically affiliated physicians engaged in research and the percent of MD/DO scientists and MD/DO-PhD scientists engaged in research.
Types of research
In 2022, physician scientists were involved in a diverse array of research (Figure 2a), and 35% of physician scientists were engaged in multiple types of research. Clinical research was the most common type of research in which physicians were engaged, with 79% of physician scientists reportedly engaged in clinical research, including 88% of academically affiliated physician scientists and 72% of nonacademic physician scientists. The most common types of research after clinical research were educational research and health services/health systems research (HSR). There were statistically significant differences in the proportion of academic and nonacademic physician scientists engaged in some types of research. Both clinical and translational research were more common among physician researchers with an academic affiliation than their nonacademic peers, while “other” research (e.g., quality improvement research) was more common among nonacademic physician scientists.
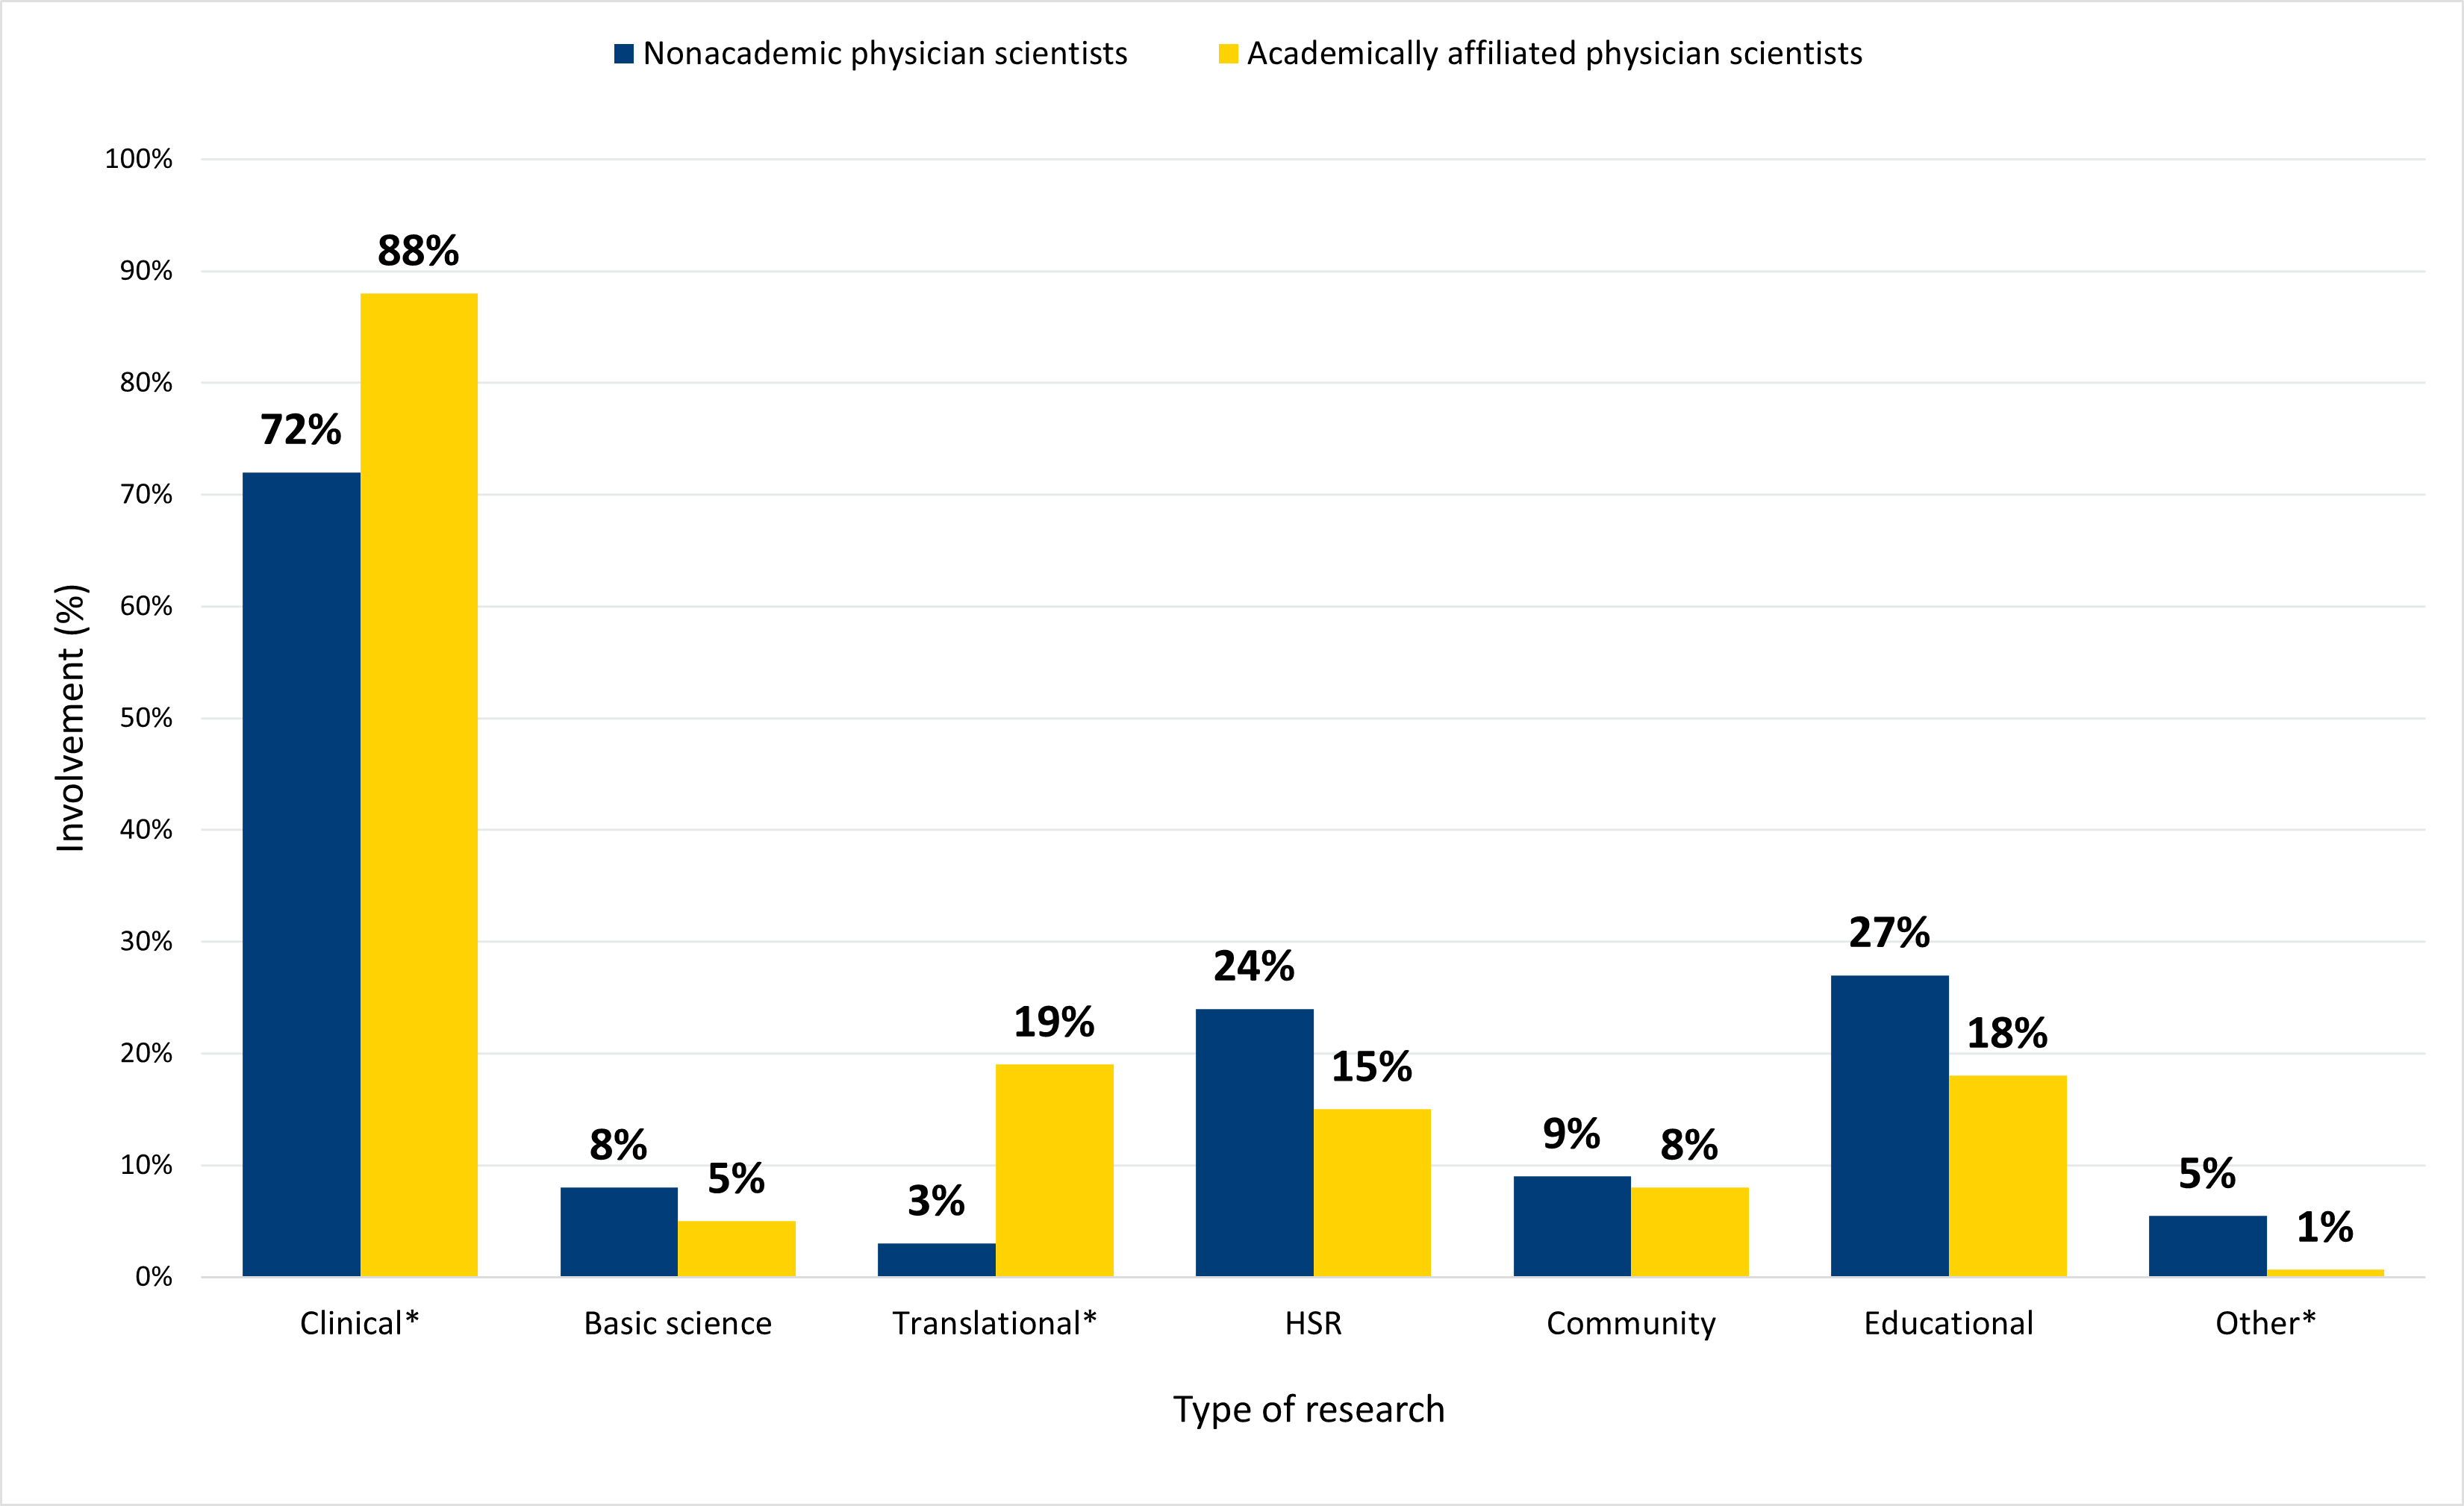
Figure 2a. Clinical and translational research were more prevalent among academically affiliated physician scientists.
Note: Asterisks (*) denote a statistically significant difference at the 95% confidence level between the percent of nonacademic and academically affiliated physicians engaged in that type of research.
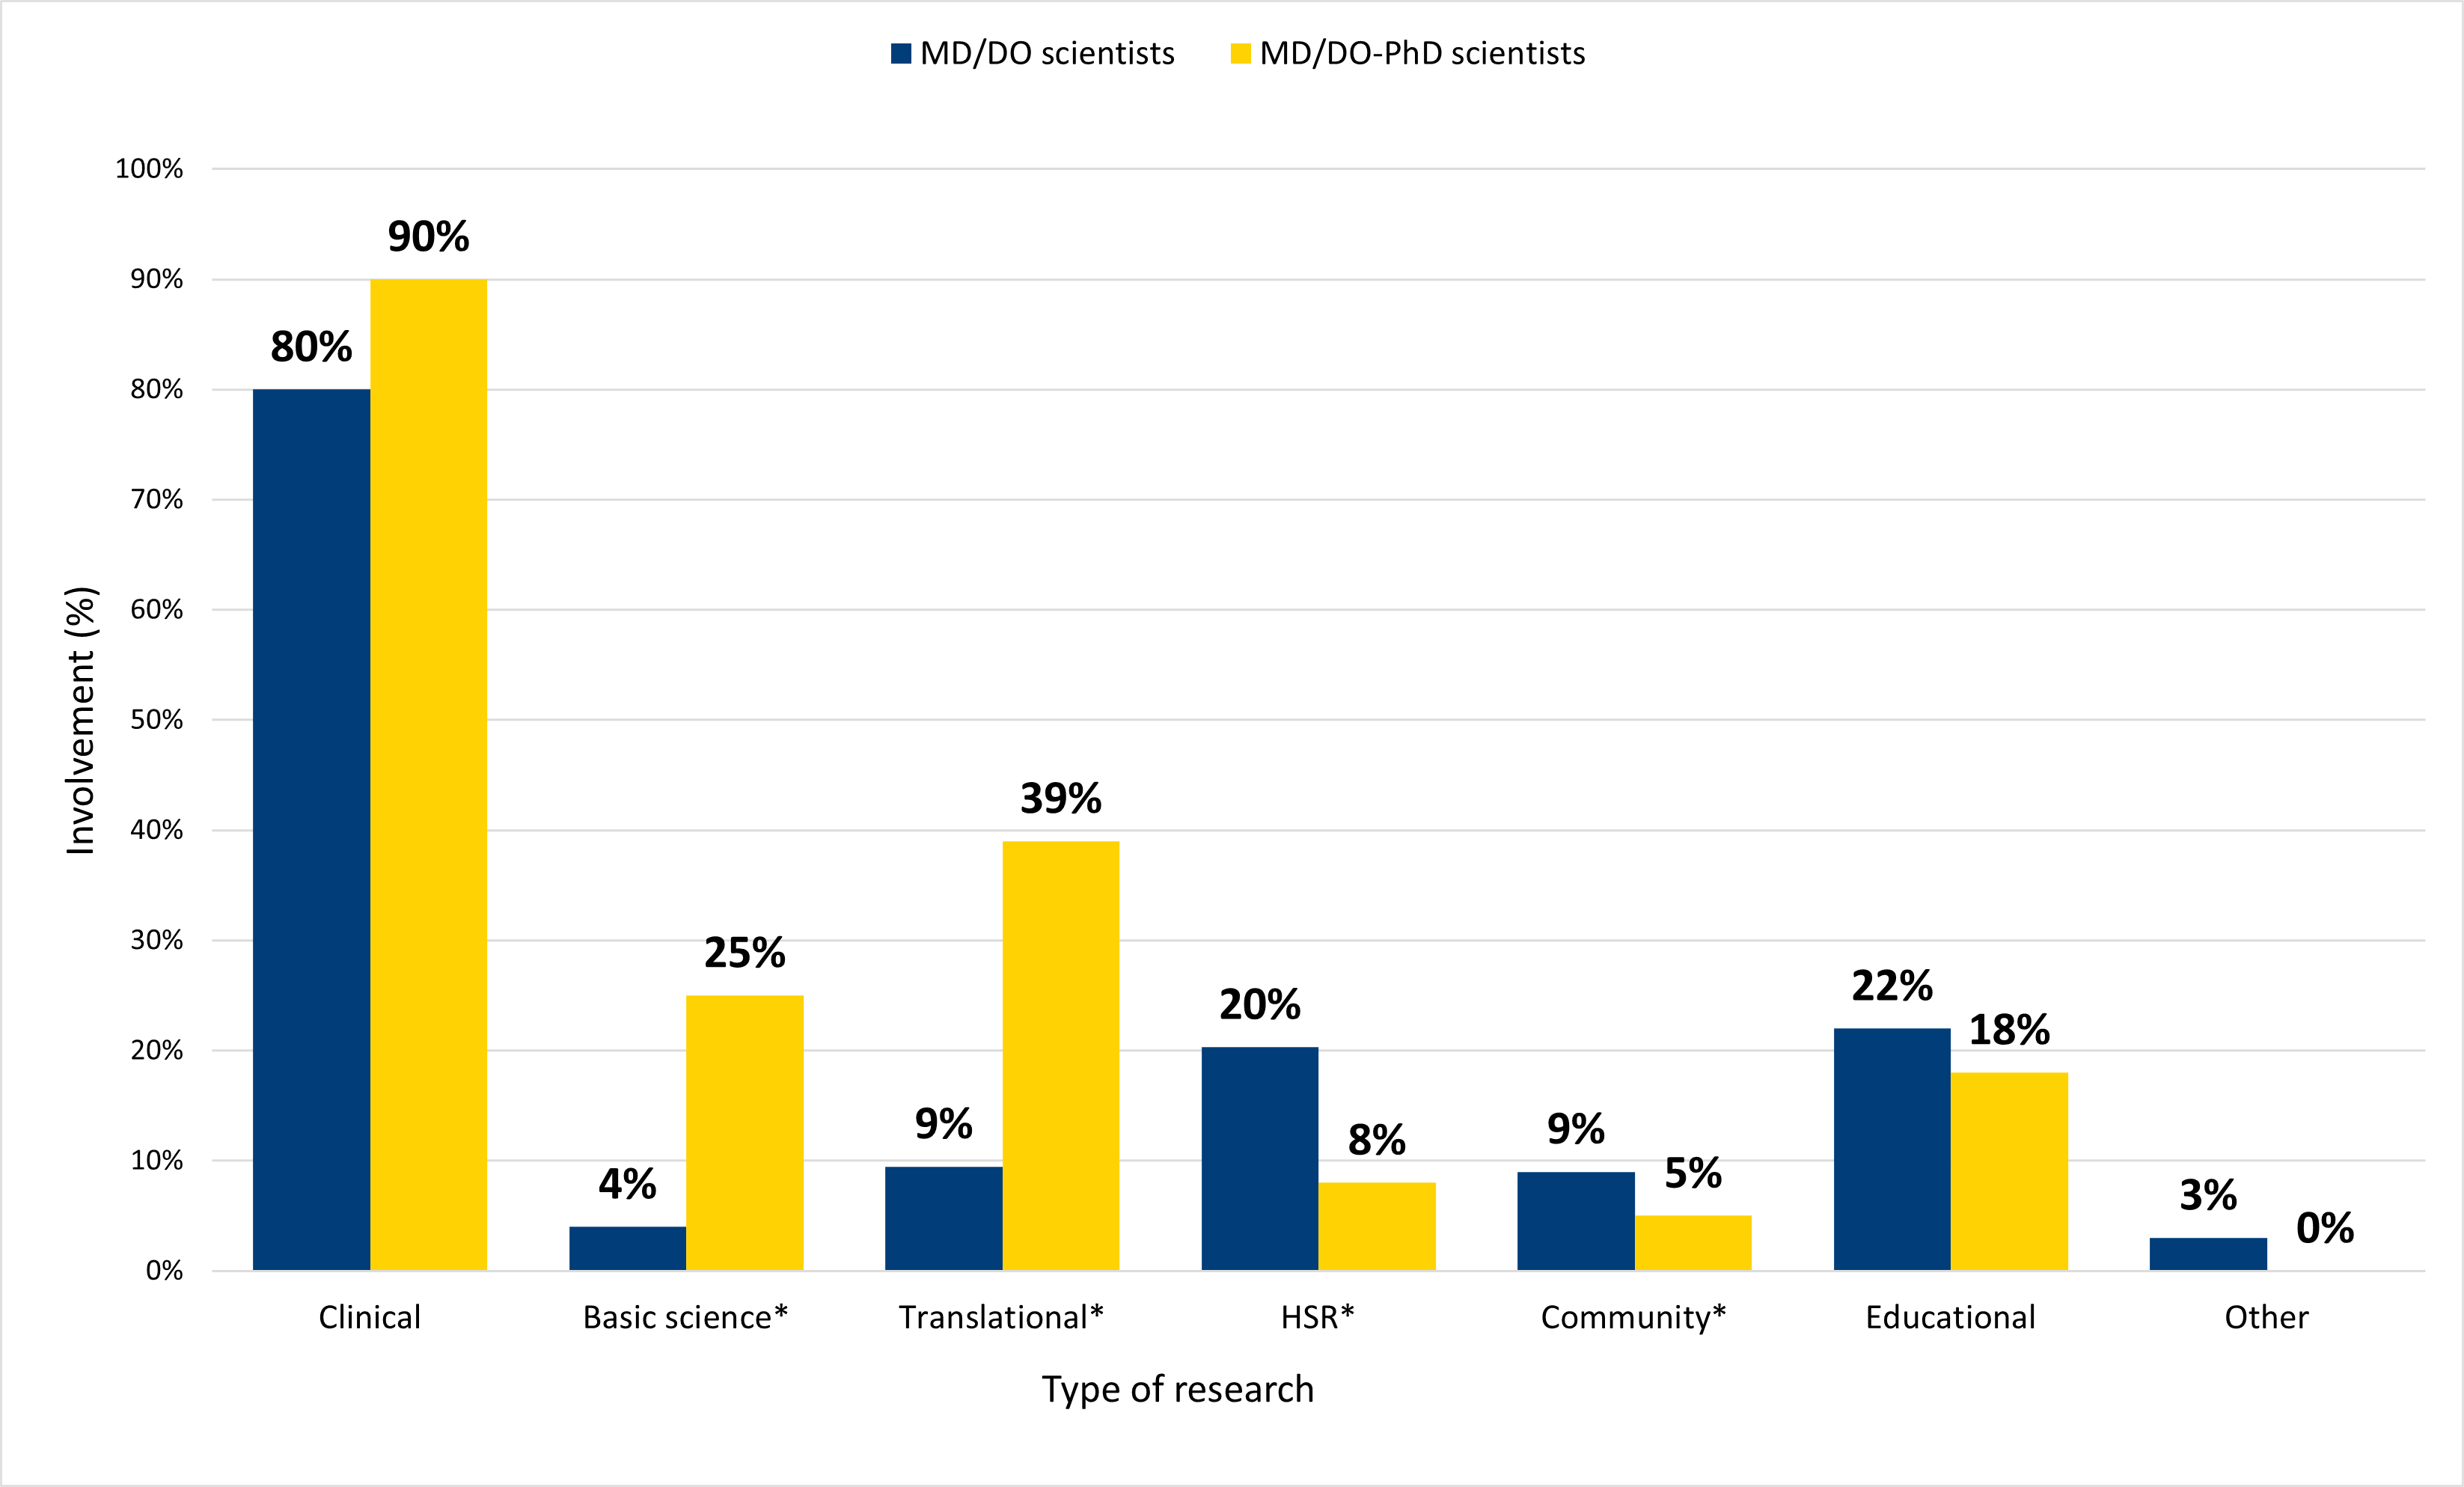
Figure 2b. A higher proportion of MD/DO-PhD scientists were engaged in basic science and translational research compared to scientists without a PhD, while scientists without a PhD engaged in HSR and community research at higher rates than their MD/DO-PhD peers.
Note: Asterisks (*) denote a statistically significant difference at the 95% confidence level between the percent of non-PhD and MD/DO-PhD physicians engaged in that type of research.
Demographic composition of physician scientists
Gender composition
The gender composition of physician scientists was comparable to the broader physician workforce (Figure 3): women comprised 37% of the overall physician workforce and 33% of physician scientists. We did not find a statistically significant difference in the gender composition of physician scientists compared to physicians not engaged in research based on whether they were affiliated with an academic institution.
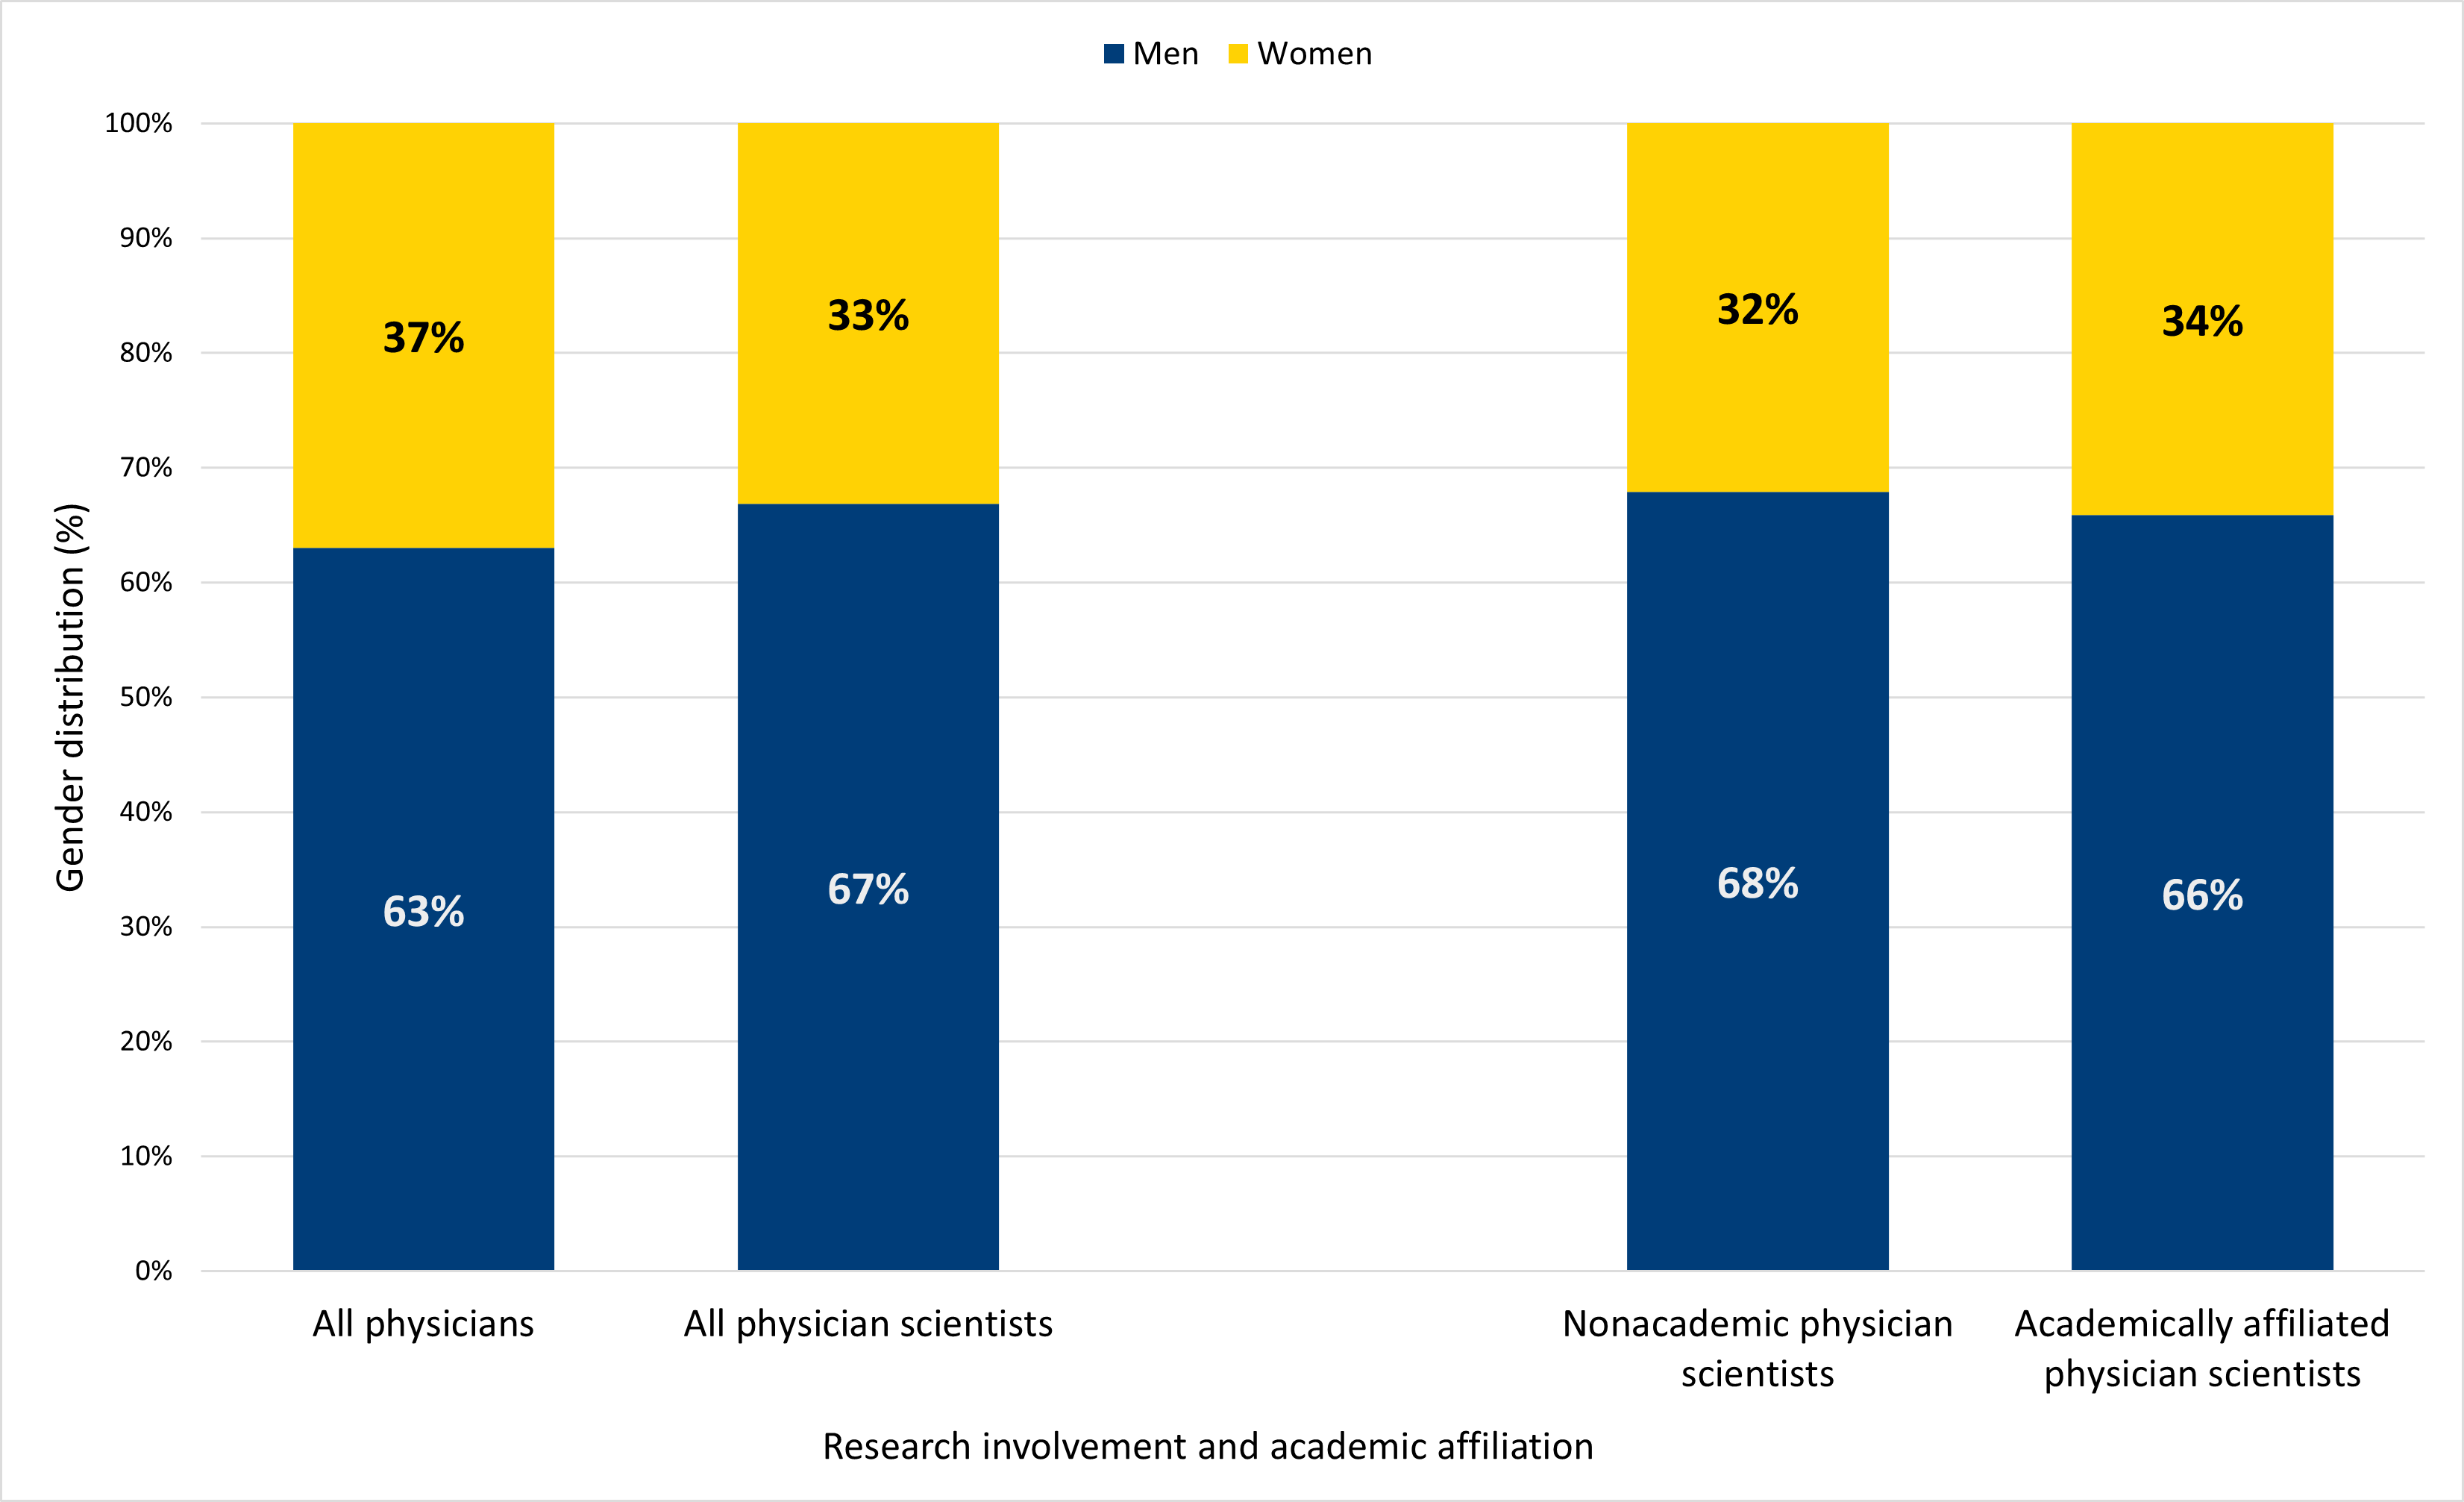
Figure 3. Women remain in the minority in both the overall physician workforce and the physician scientist workforce.
Note: “Women” includes cisgender women and trans women; “men” includes cisgender men and trans men. Genderqueer/ nonbinary respondents are excluded from the analysis due to small numbers.
Racial/ethnic composition
We also examined the racial and ethnic composition of respondents who were physician scientists compared to the racial and ethnic composition of physicians overall. There were no statistically significant differences in the racial and ethnic composition of subgroups of the physician workforce based on research involvement or academic affiliation. About two-thirds of physicians overall and physician scientists specifically were White (62% and 65%, respectively). Only about 6% to 7% of the workforce were individuals from racial and ethnic groups considered underrepresented, while about a quarter identified as Asian.
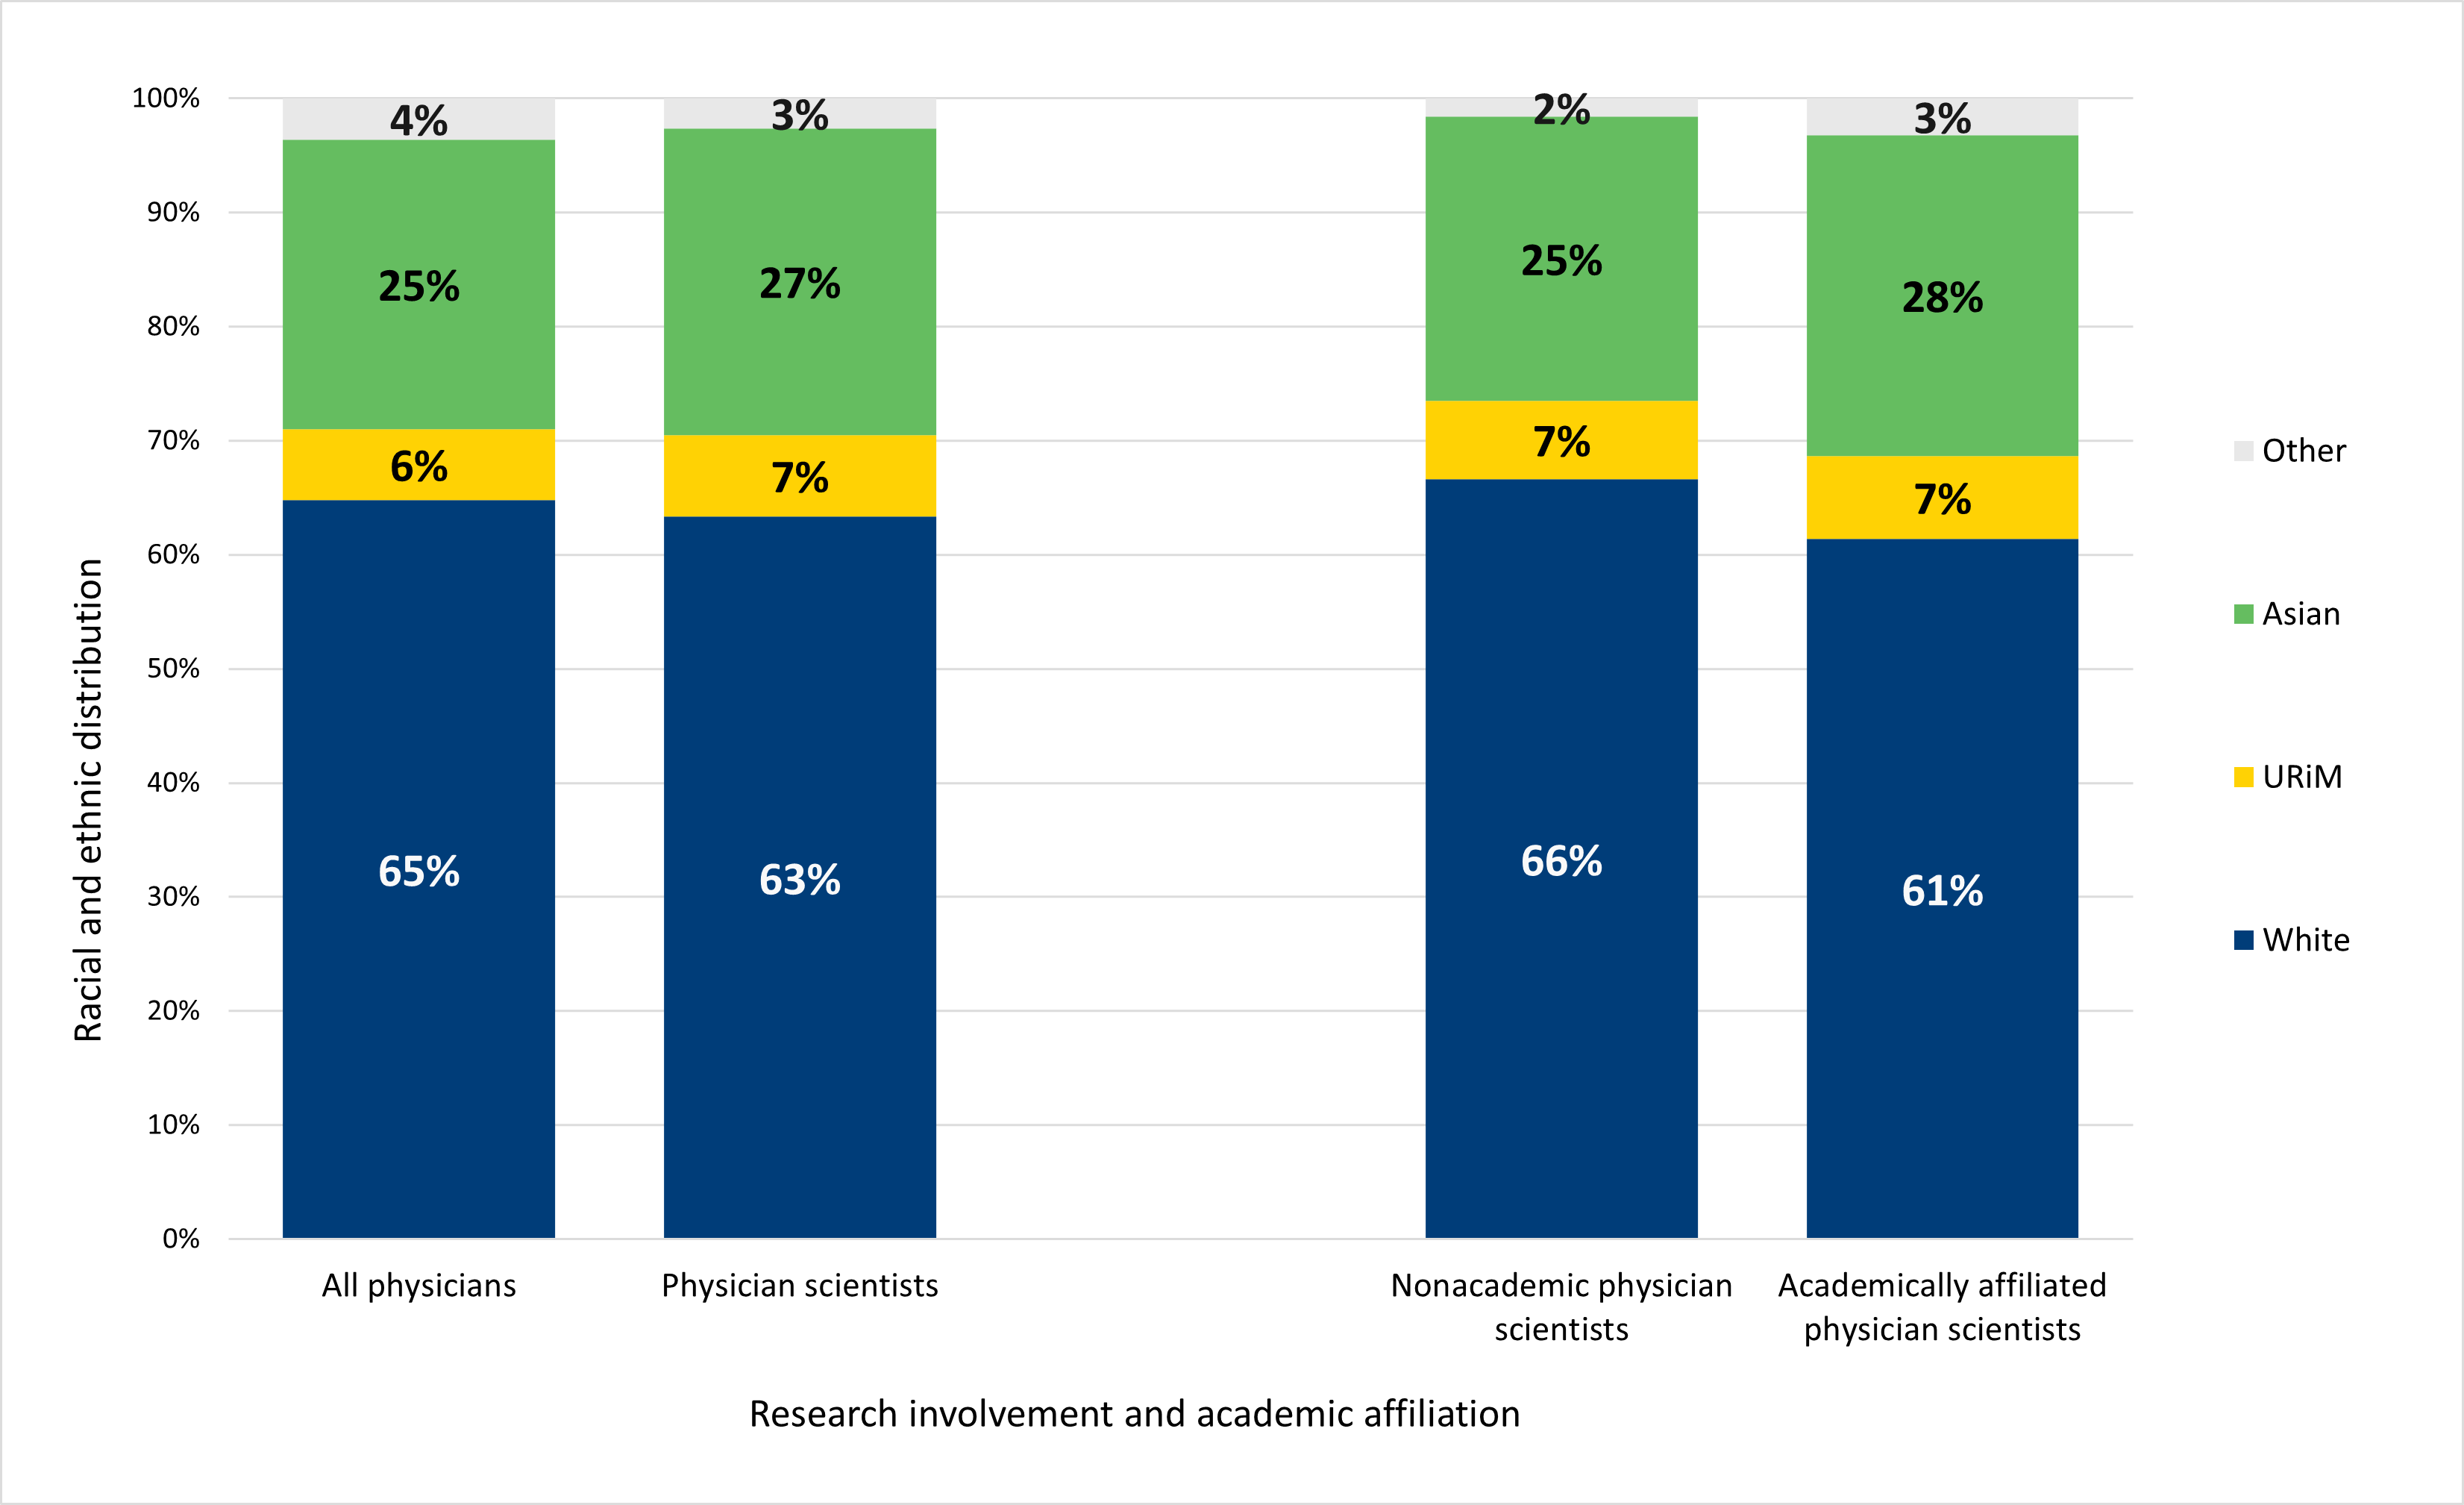
Figure 4. White and Asian respondents together make up the vast majority of the overall physician and physician scientist workforce
Note: “URiM” respondents include respondents who are Hispanic, Latino, or of Spanish origin; American Indian or Alaskan Native respondents; Black or African American respondents; or Native Hawaiian or other Pacific Islander respondents alone or in combination with any other race/ethnicity. “Other” race/ethnicity includes respondents who identify as a race/ethnicity
Respondent origin (rurality/urbanicity)
Physicians who grew up in urban environments were more highly represented among physician scientists (37%) compared to physicians overall (29%), while those who grew up in rural environments were less well represented among physician scientists relative to the overall workforce (Figure 5). Overall, physicians who grew up in urban environments were more likely to be engaged in research than their peers who grew up in a rural or suburban environment, a statistically significant difference. Within the subgroup of physician scientists, a higher proportion of academically affiliated than nonacademic physician scientists grew up in urban areas, while a higher proportion of nonacademic than academically affiliated scientists grew up in rural areas. However, this difference was not statistically significant.
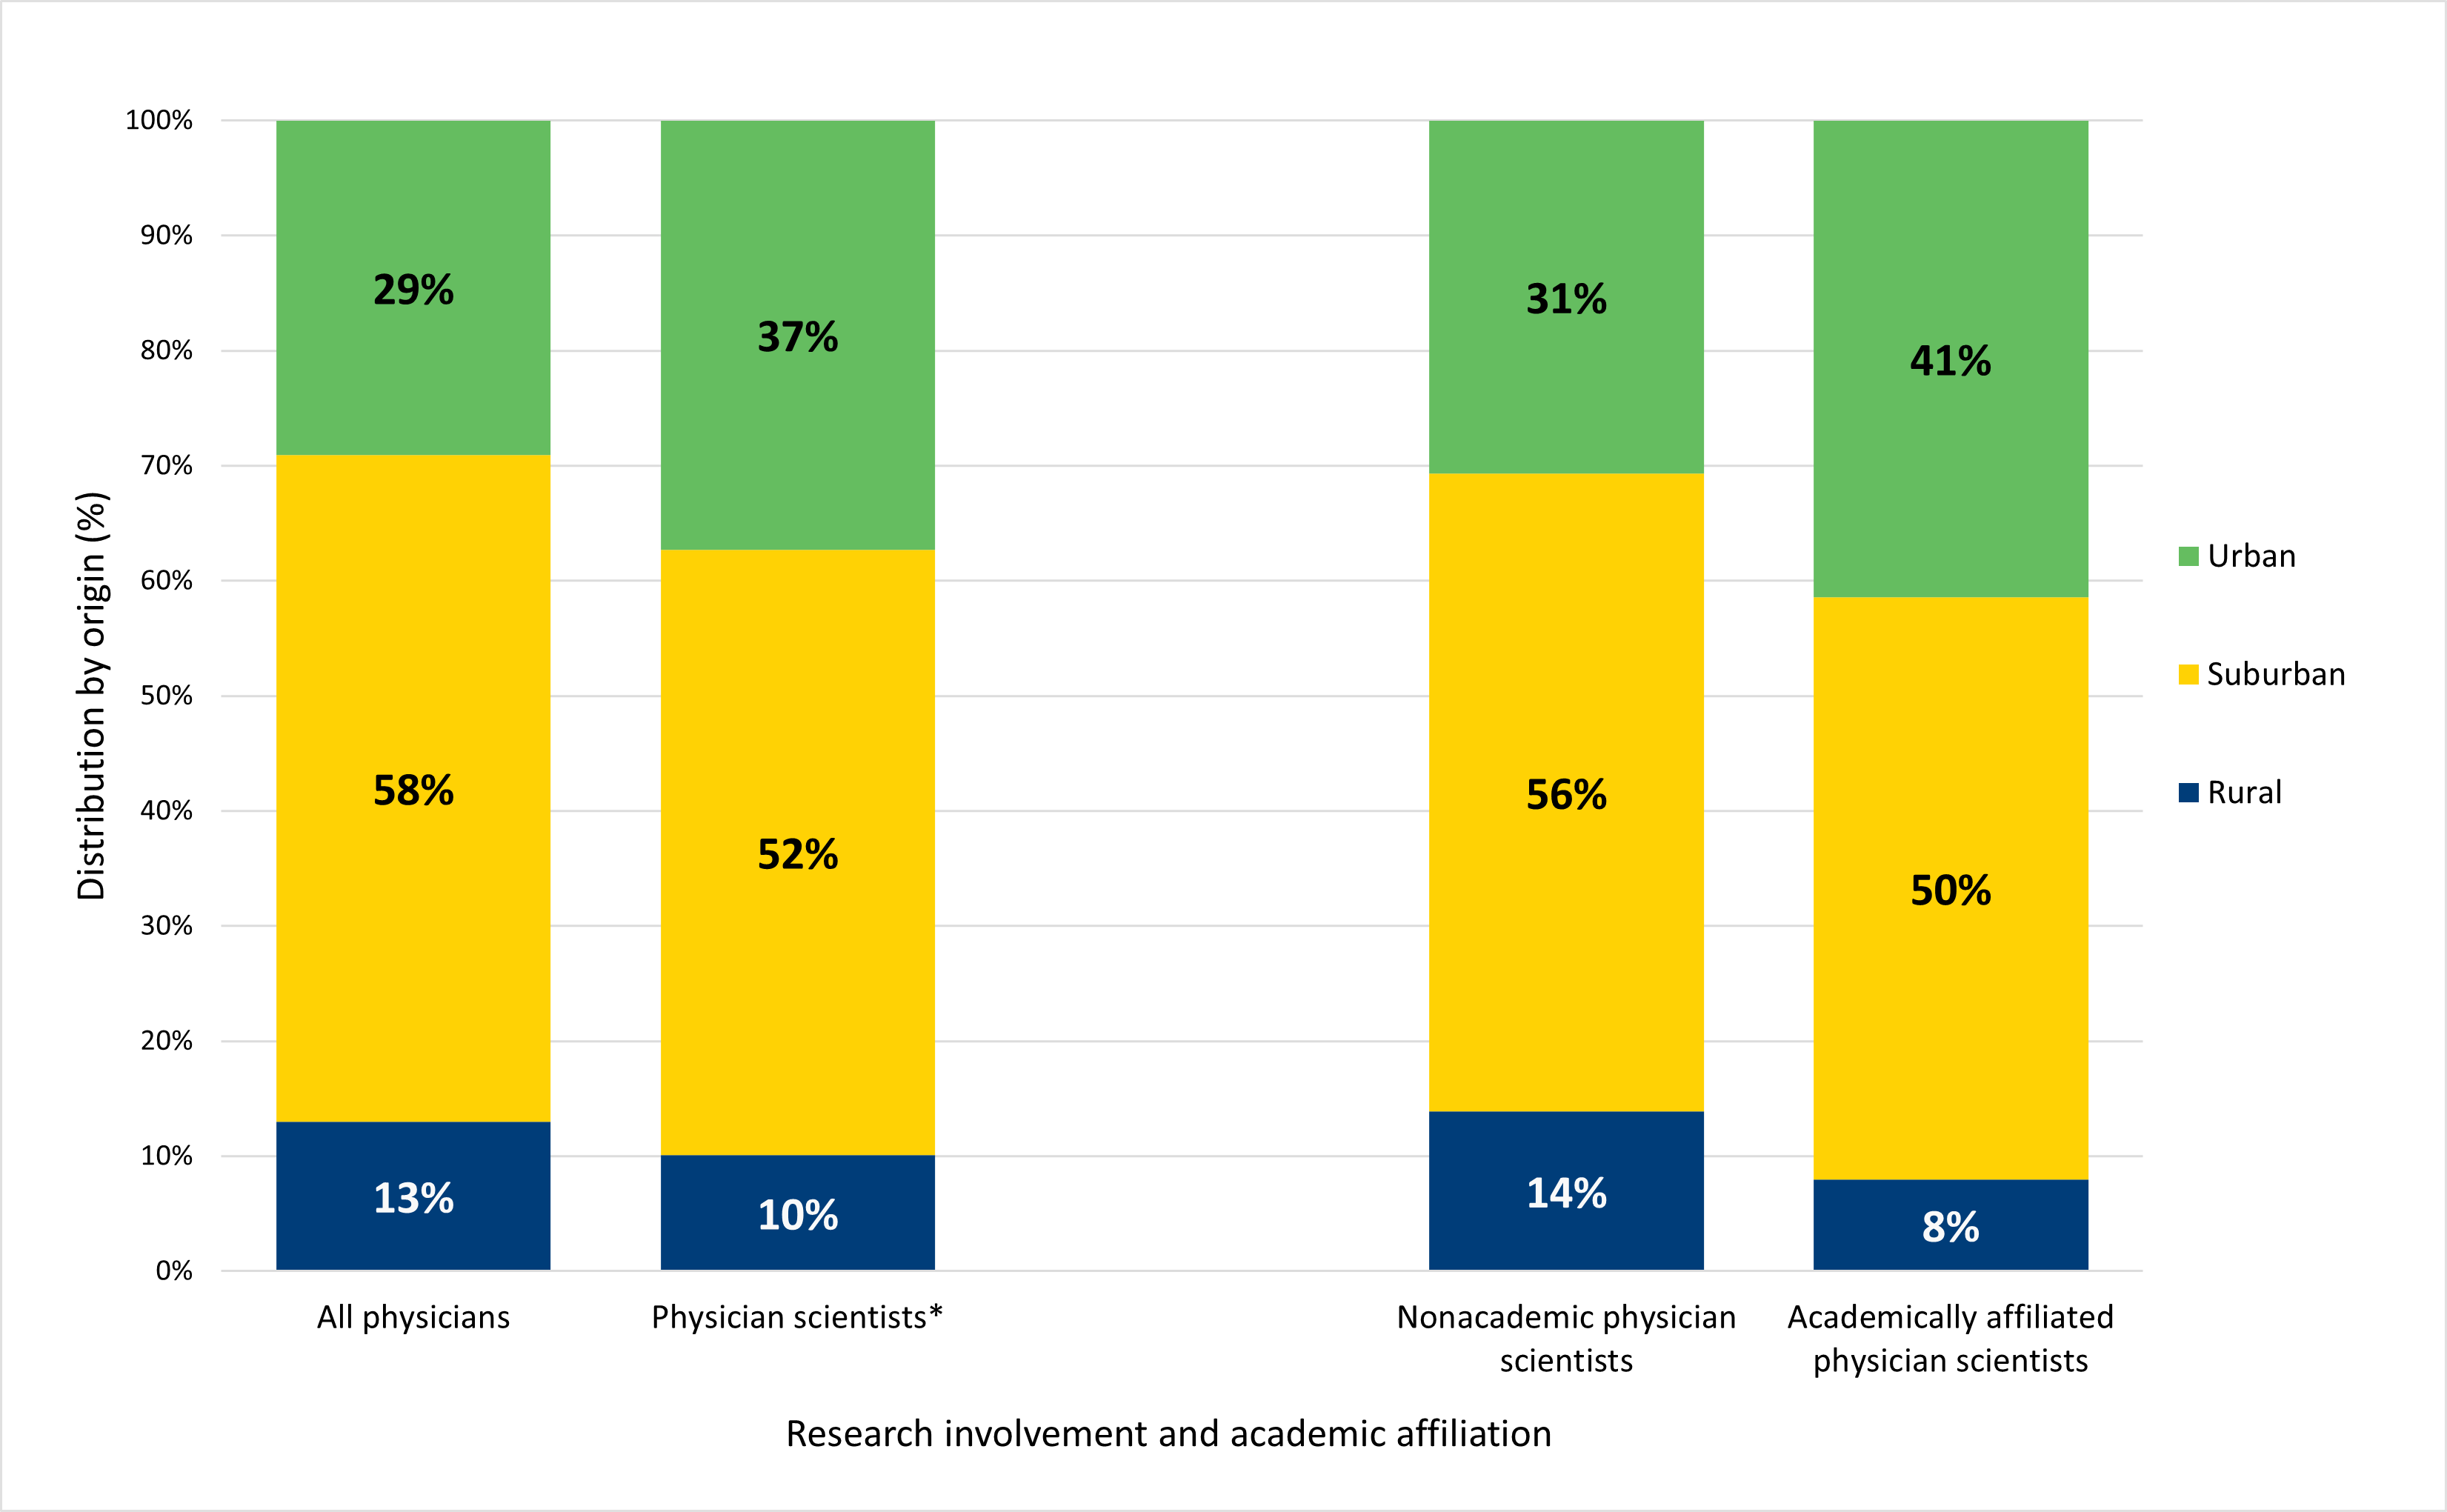
Figure 5. Physicians who grew up in urban environments were more likely to conduct research compared to their suburban and rural peers.
Note: Asterisk (*) denotes a statistically significant difference at the 95% confidence level between the representation of urban-origin individuals among physician scientists compared to rural and suburban individuals. Also note that percentages may not sum to 100% due to rounding.
Work experiences of the physician scientist workforce
Work hours
Although the demographic characteristics of physician scientists were closely aligned with physicians more broadly, their experiences differed in some notable ways. First, physician scientists overall reported working longer hours than their peers (Figure 6). Physician scientists worked an average of five additional hours each week compared to physicians not engaged in research, a statistically significant difference. Within the subgroup of physician scientists, however, although academically affiliated physician scientists reportedly worked more hours on average than their counterparts, the difference was not statistically significant.
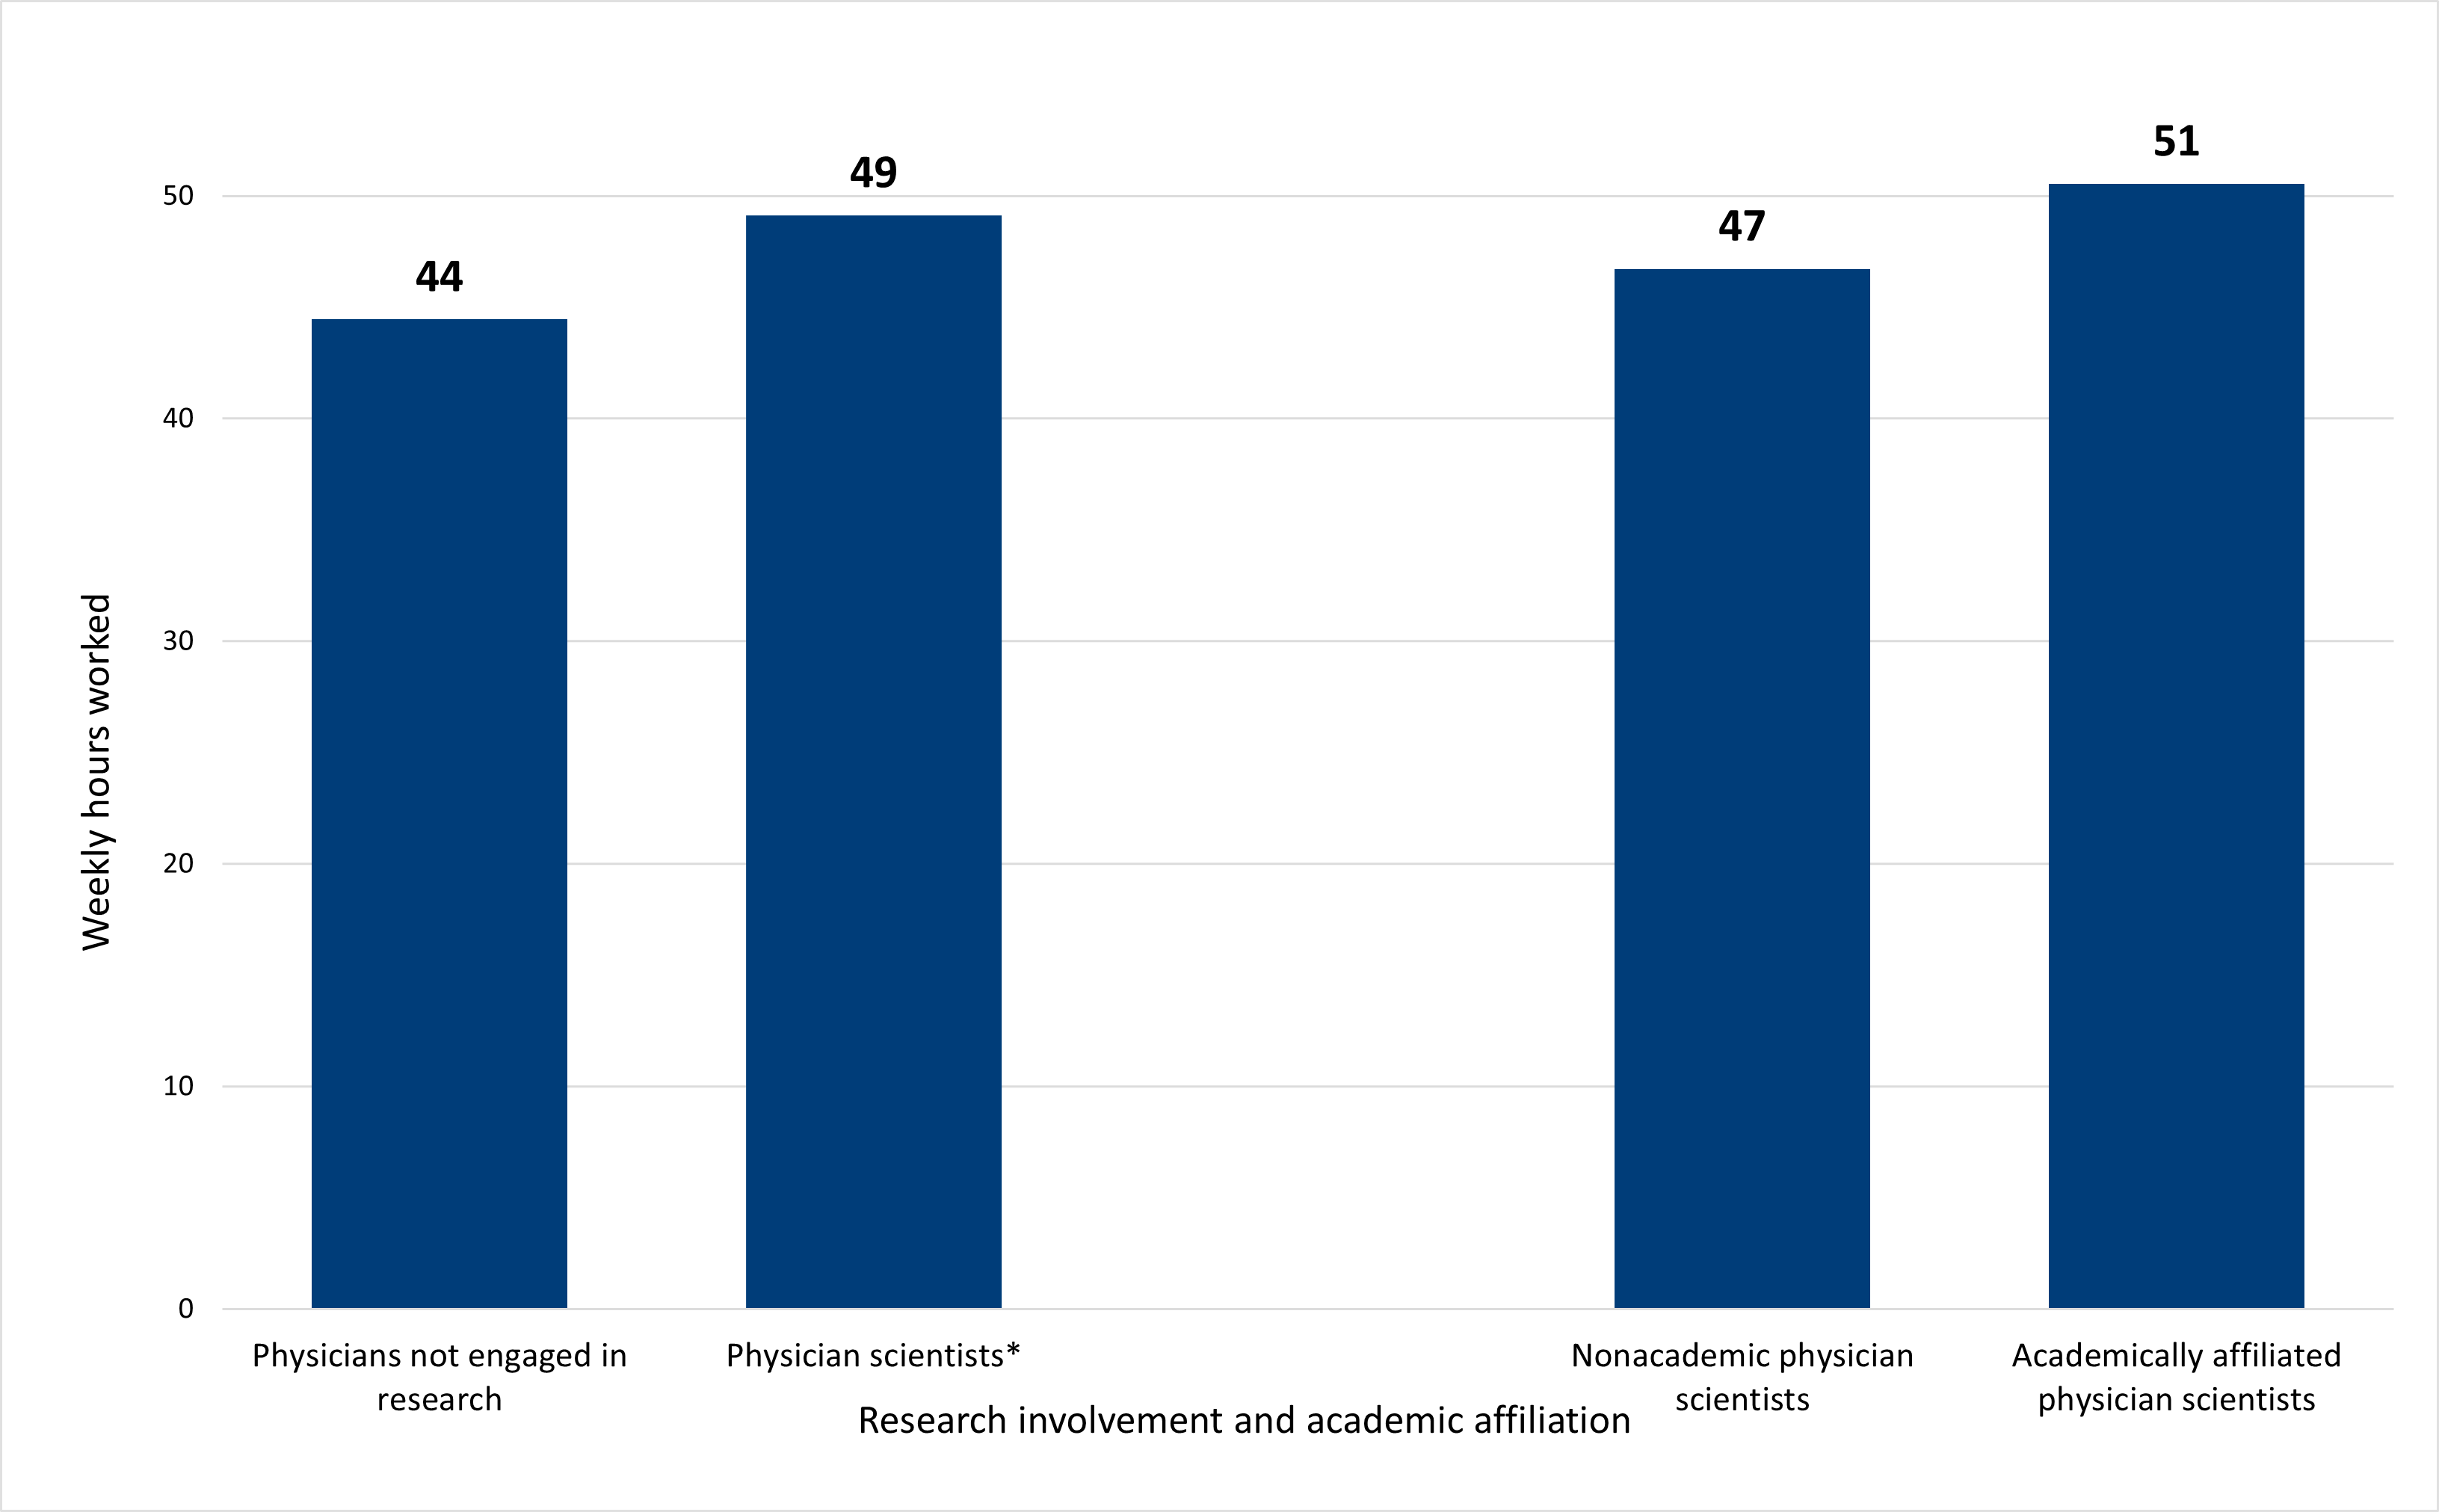
Figure 6. Physician scientists work more hours than their non-scientist peers.
Note: Asterisk (*) denotes a statistically significant difference in the typical hours worked at the 95% confidence level between physician scientists and physicians not engaged in research.
Exposure to mistreatment from coworkers
In addition to being associated with working longer hours, engagement in research was also associated with higher exposure to mistreatment6: a higher percentage of physician scientists (26%) reported mistreatment in the past year compared to their peers not engaged in research (21%) (Figure 7), a statistically significant difference.
Again, exposure to mistreatment in the past year did not vary significantly within the physician scientist workforce: although a slightly higher percentage of academically affiliated physician scientists reported mistreatment compared to those not affiliated with an academic institution, this difference was not statistically significant.
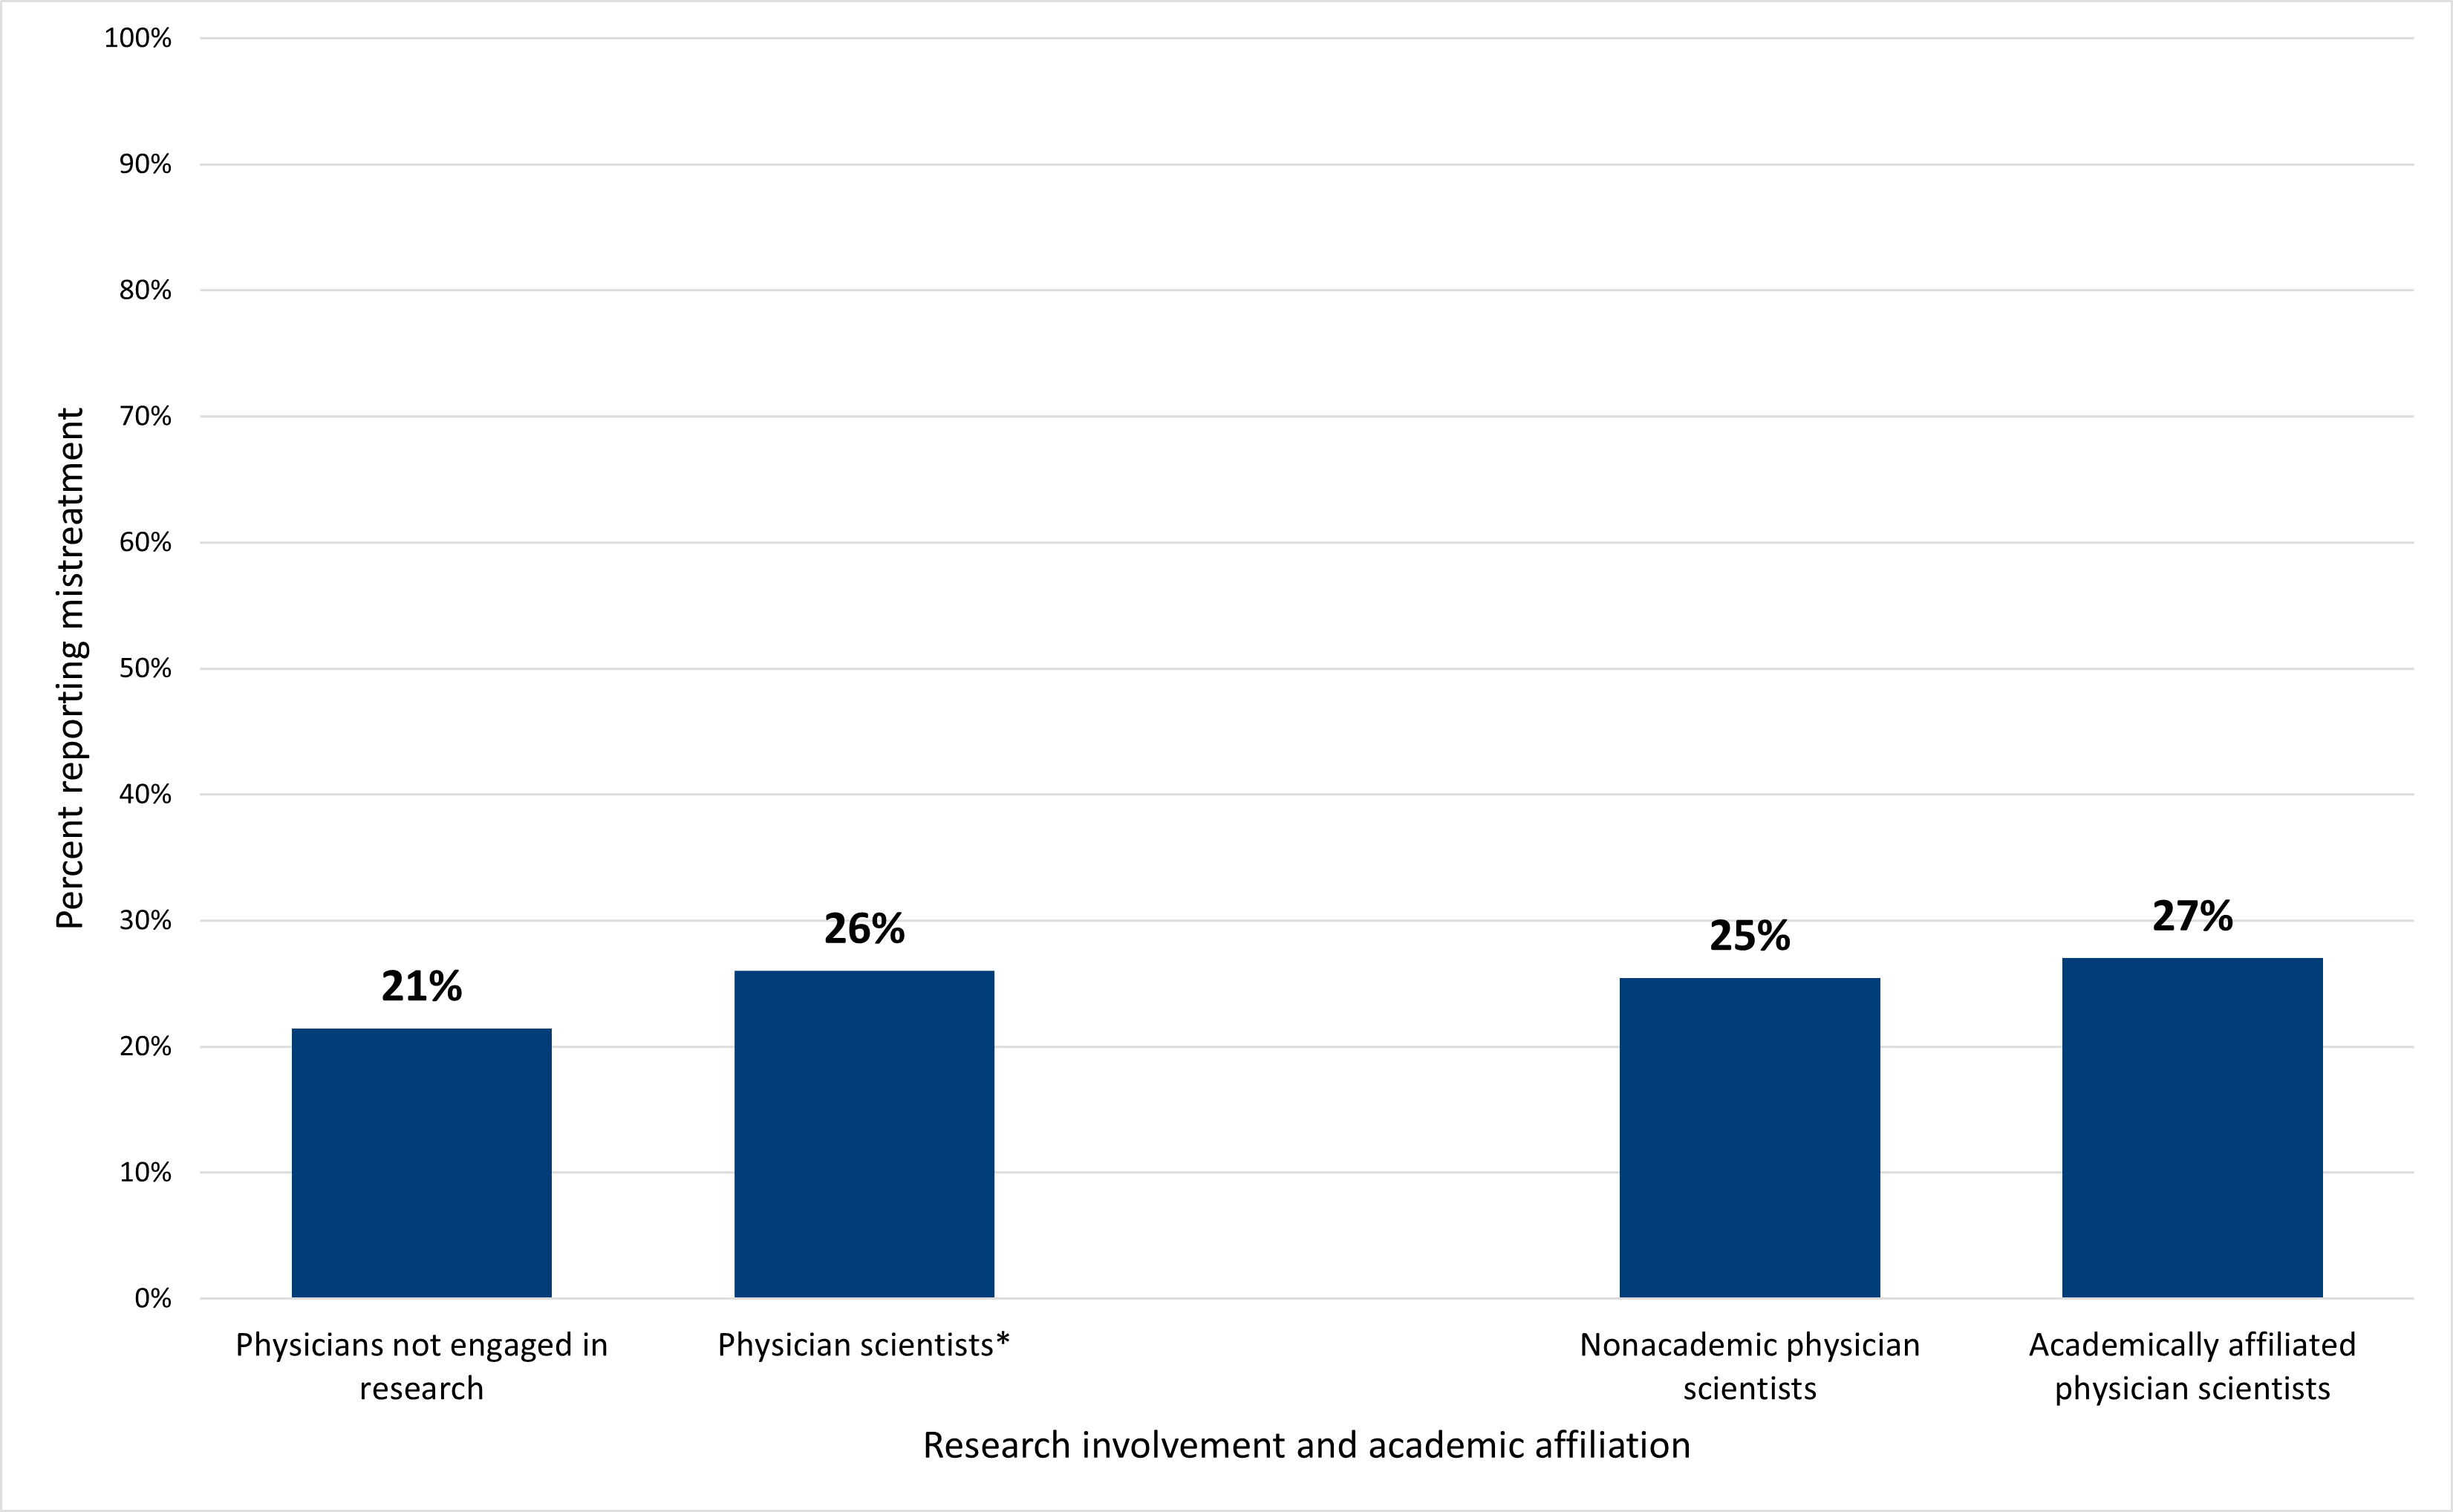
Fig. 7. A higher proportion of physician scientists reported personal experiences of mistreatment from colleagues than their peers not engaged in research.
Note: Asterisk (*) denotes a statistically significant difference in exposure to mistreatment at the 95% confidence level between physician scientists and physicians not engaged in research. Also note that percentages may not add to 100% due to rounding.
Career satisfaction: work-life balance
Although physician scientists were exposed to mistreatment from colleagues at higher rates and worked longer hours than their peers who were not engaged in research, these experiences did not appear to translate into differences in their career satisfaction. For example, although we might expect longer work hours to correspond to lower rates of satisfaction with work-life balance, physician scientists reported satisfaction at a similar rate as their peers not engaged in research, such that there were no statistically significant differences (Figure 8). Furthermore, there were no statistically significant differences within the physician scientist workforce by academic affiliation.
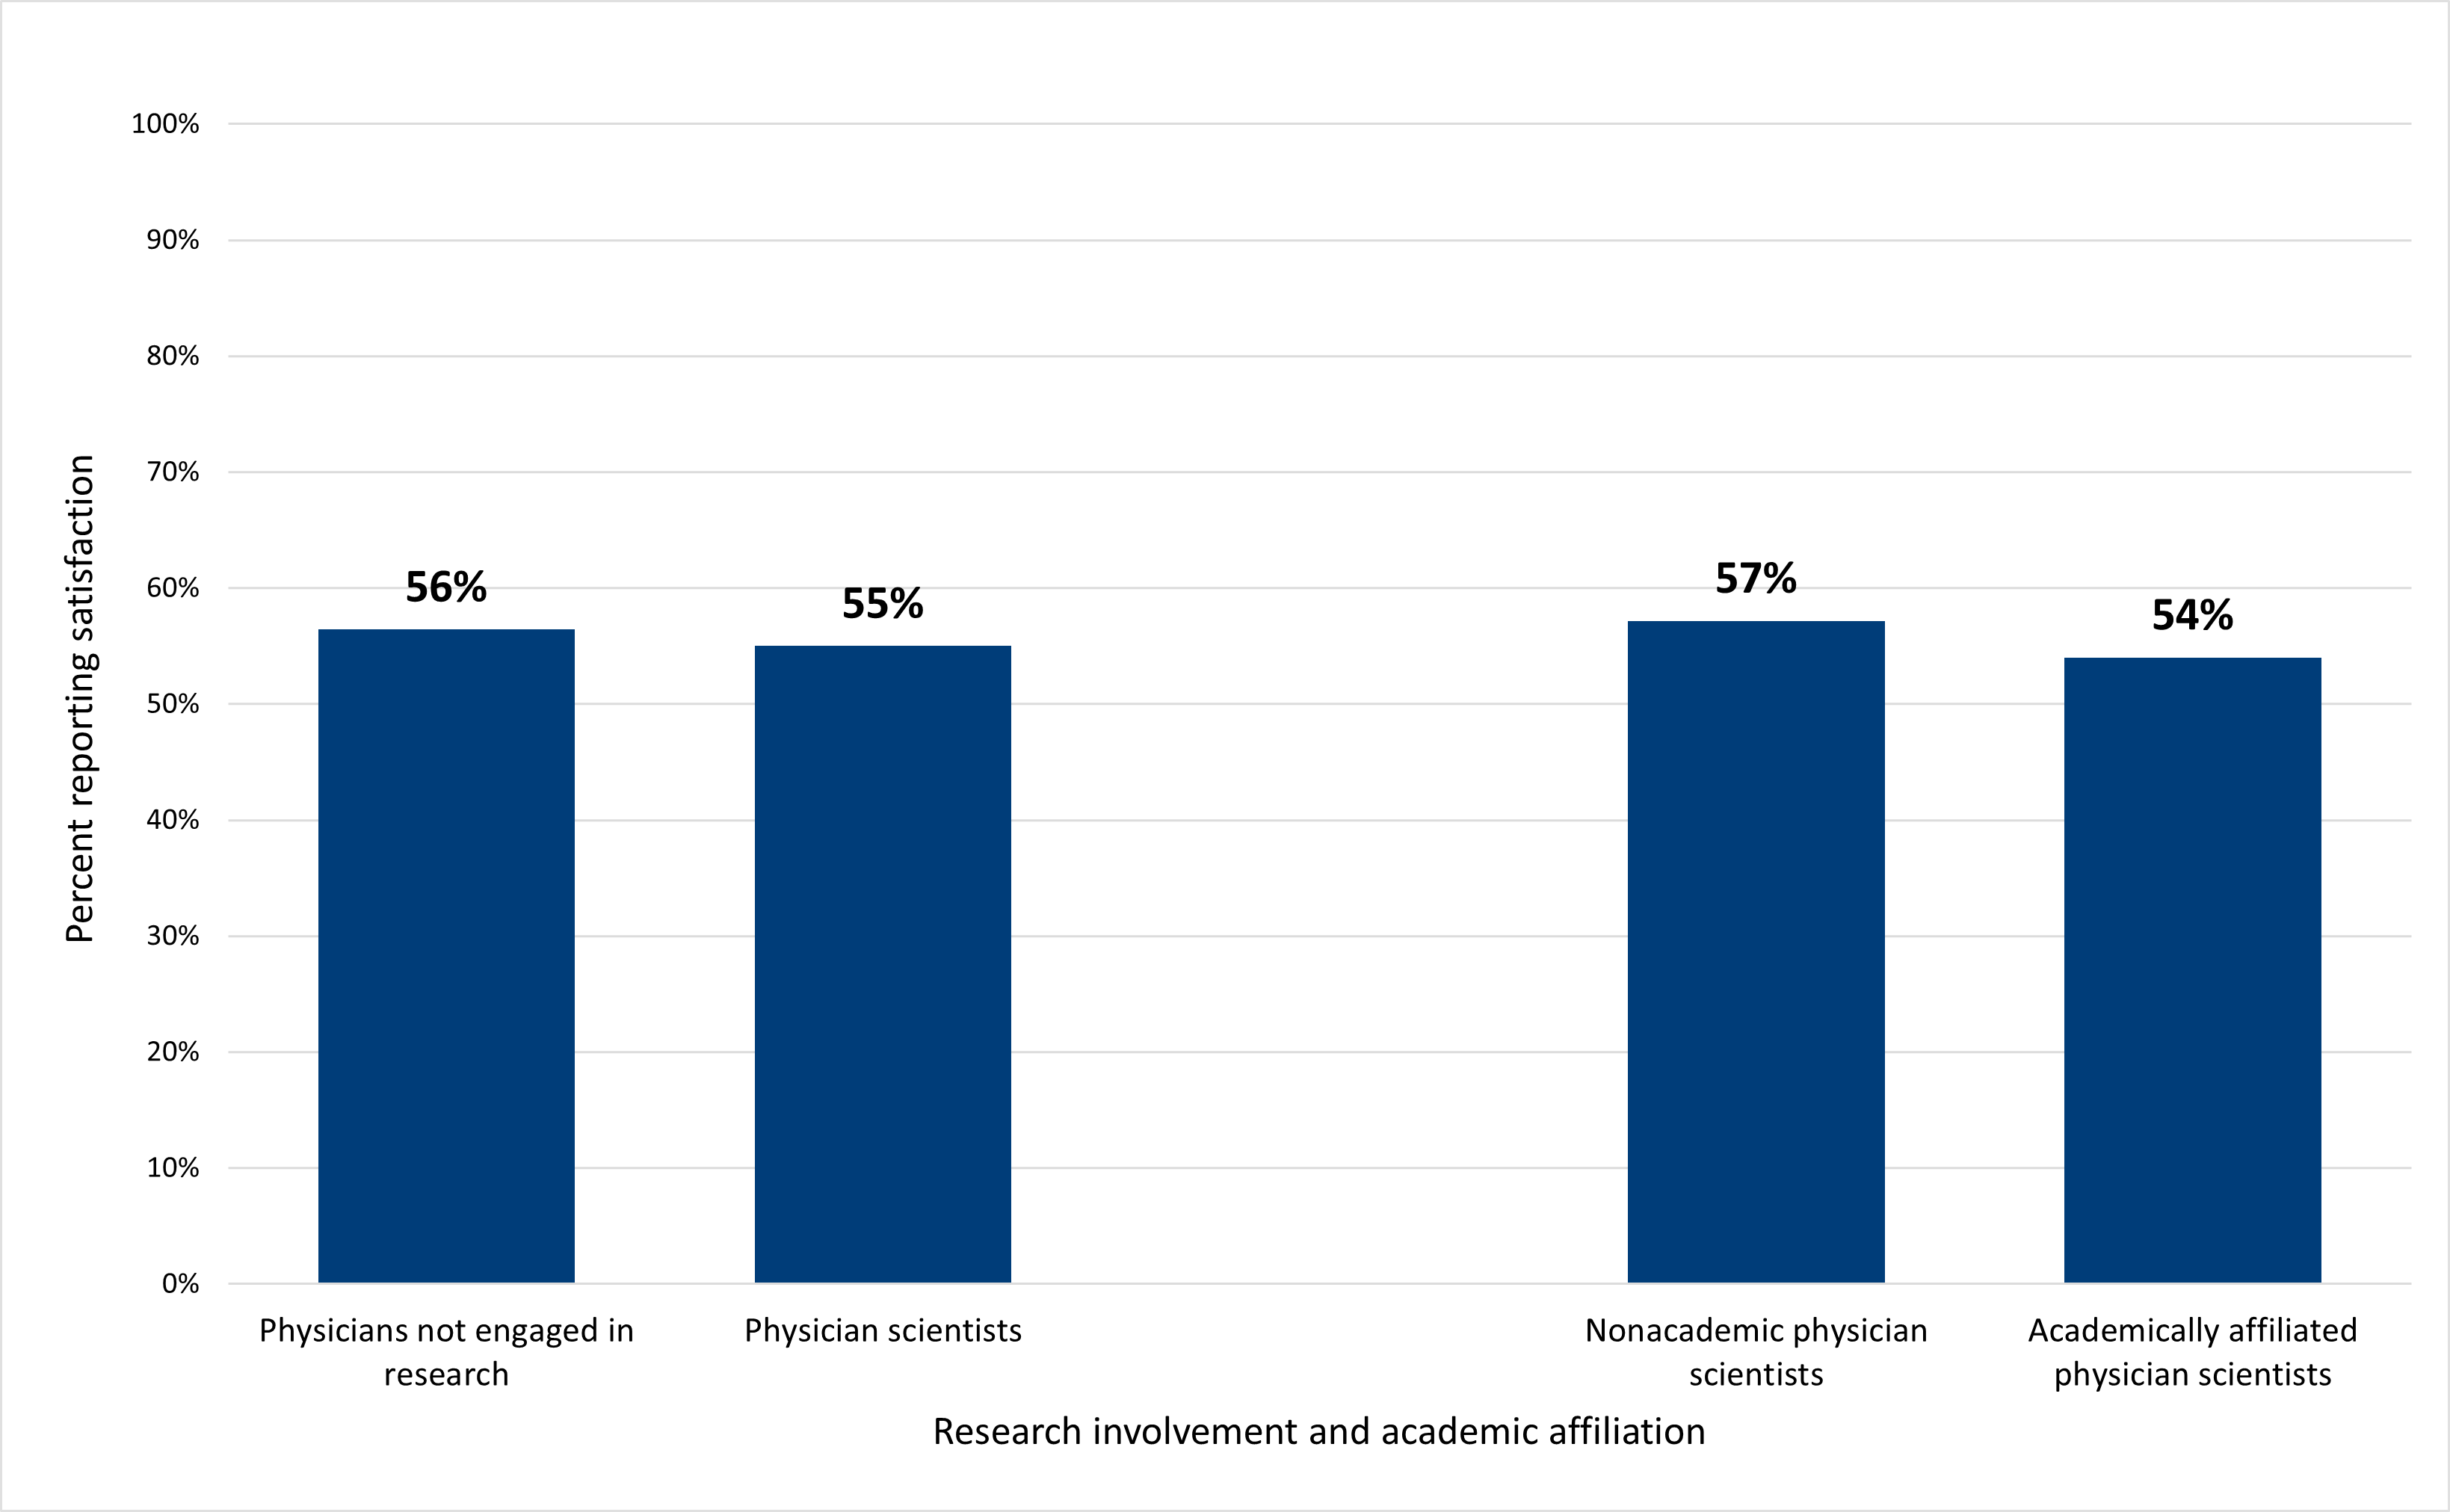
Figure 8. Physician scientists reported satisfaction with their work-life balance at similar rates as their peers not engaged in research.
Career satisfaction: overall
Overall career satisfaction was high among physicians broadly and physician scientists more specifically. Once again, physician scientists reported satisfaction either to the same, or higher, level as their peers not engaged in research (Figure 9), and there was no significant variation within the physician-scientist subgroup.
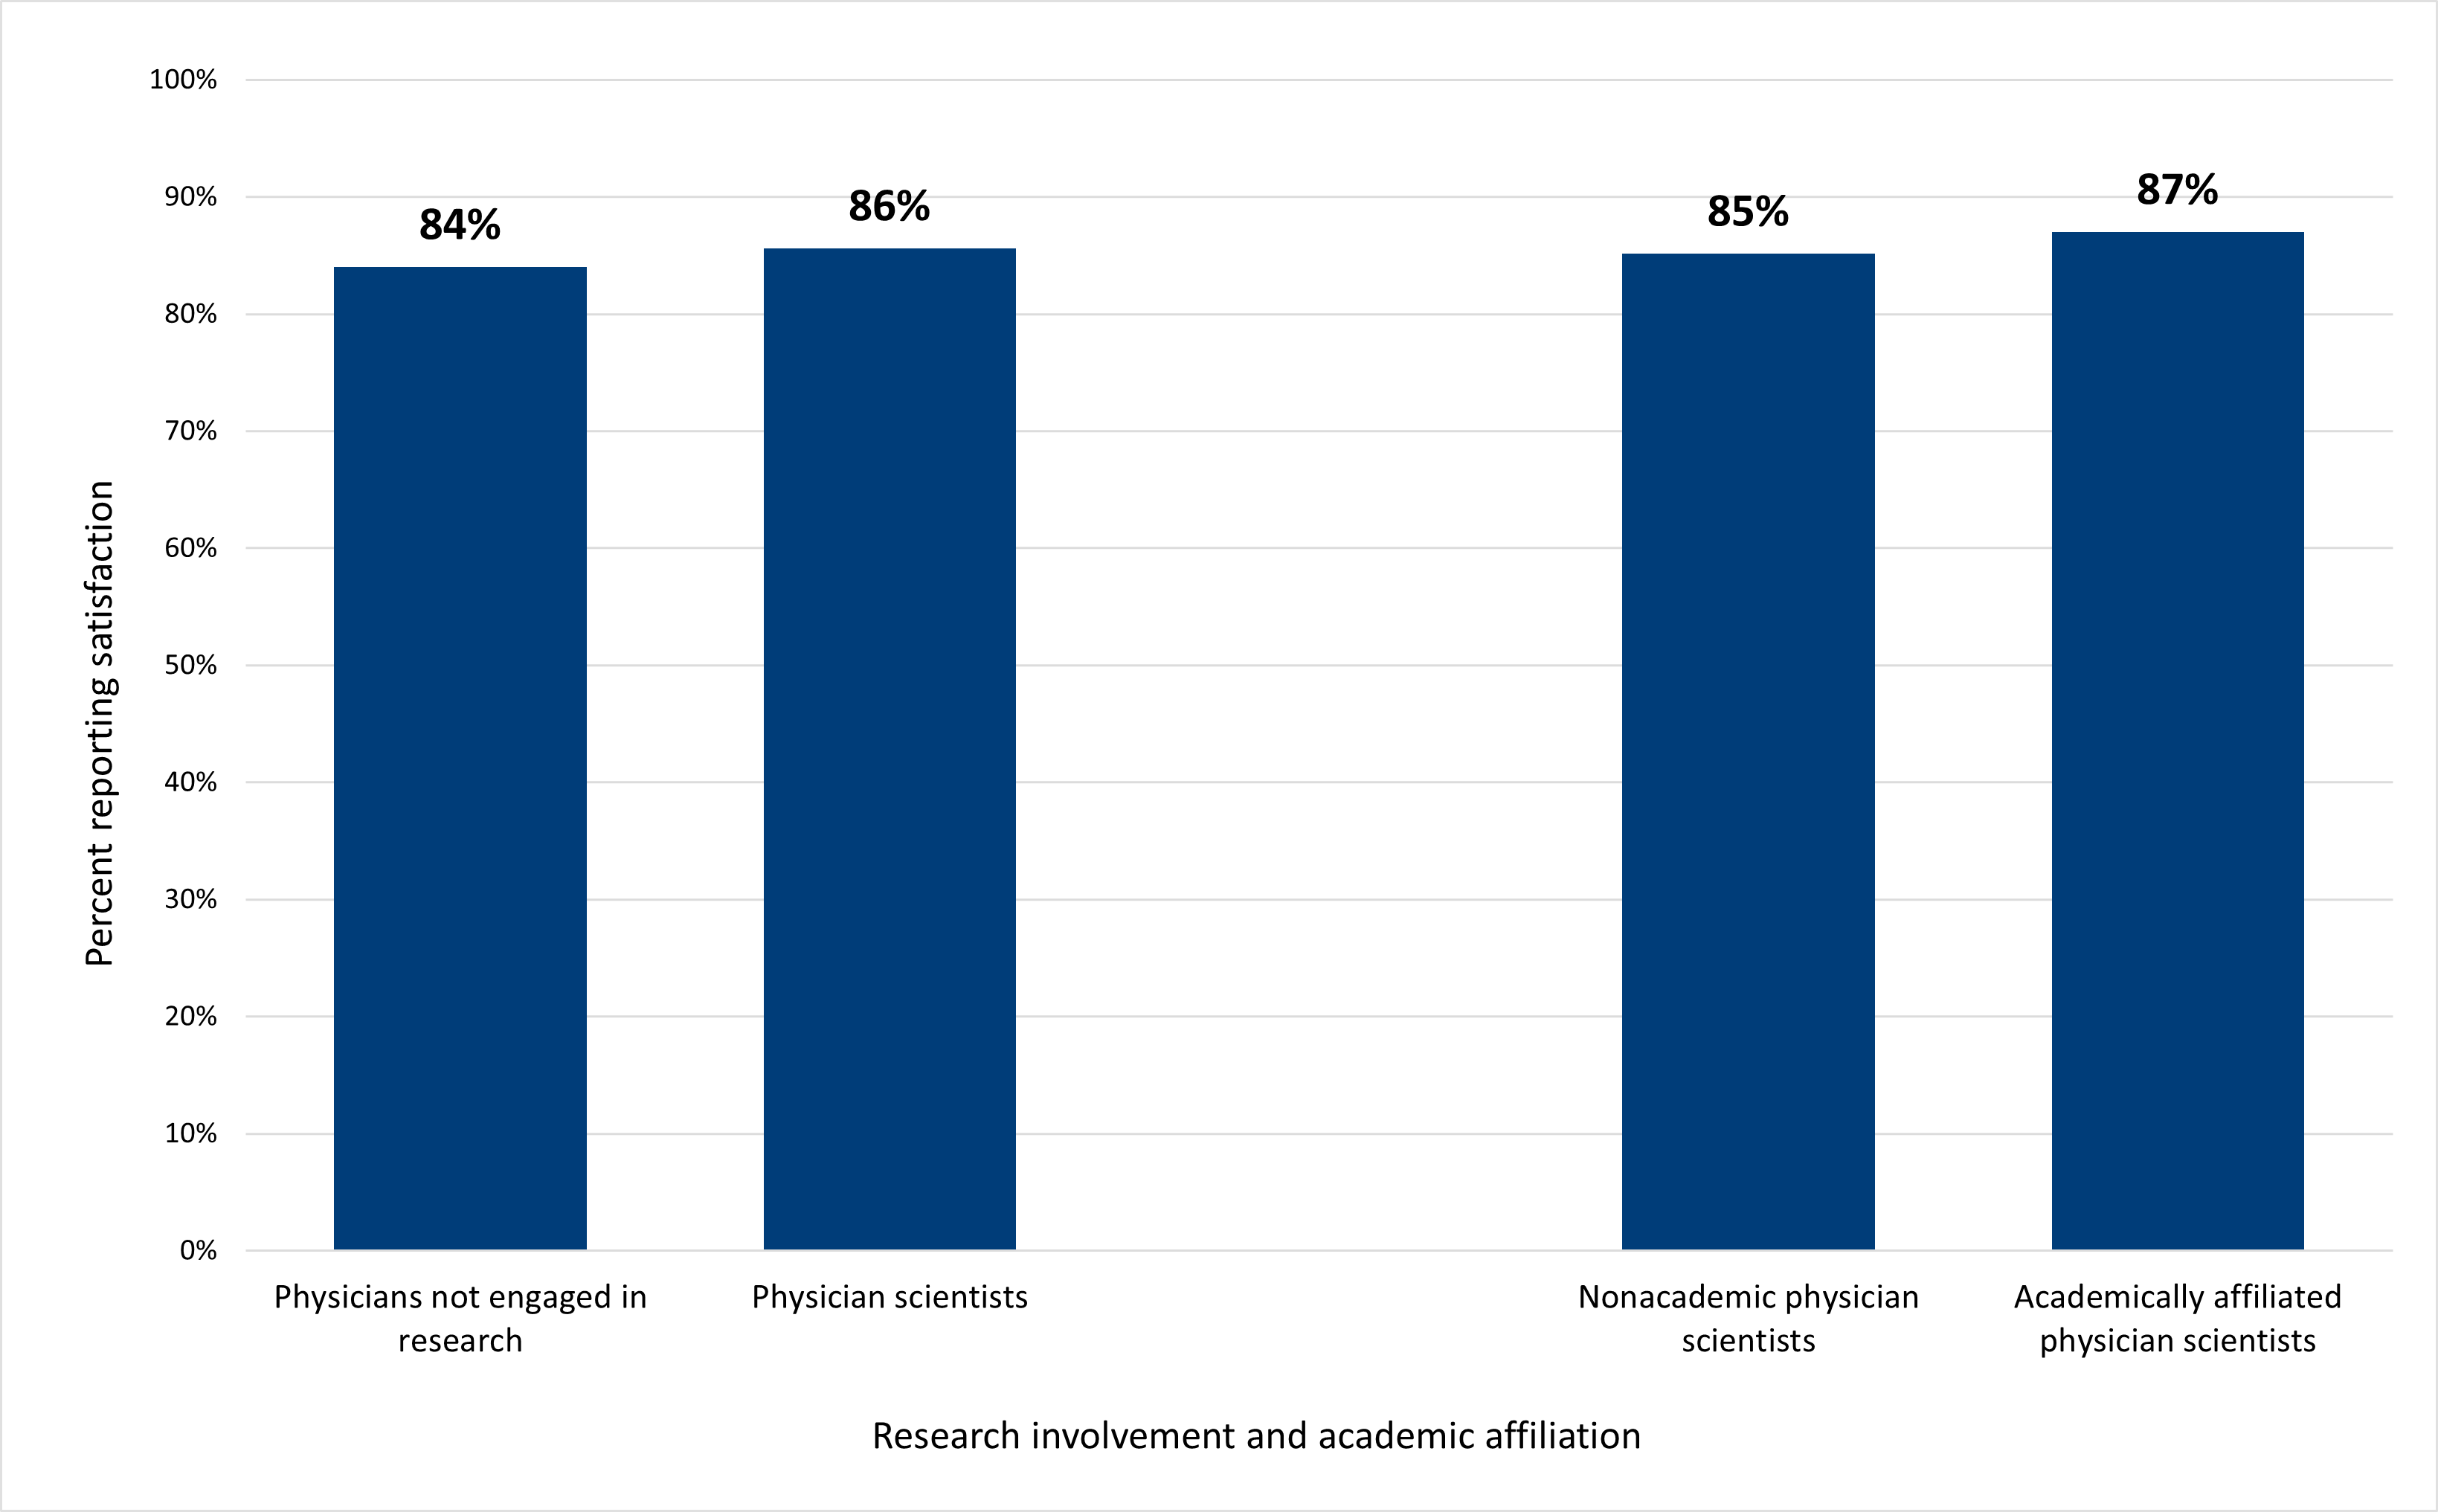
Figure 9. Physician scientists reported career satisfaction at similar rates as their peers not engaged in research
Conclusion
Physician scientists mirror the broader physician workforce along the lines of gender and race/ethnicity. Women remain significantly underrepresented both within the broader physician workforce and among the subgroup of physician scientists, although recent trends in medical school matriculation indicate that we might expect to see greater gender parity in the workforce in the years to come.7 Along the lines of race and ethnicity, physicians overall and physician scientists specifically remain majority White. Much work remains to be done to increase the representation of Black, Hispanic/Latino, and indigenous physicians in the overall workforce as well as among physician scientists. And finally, urban-origin physicians are more likely to pursue research as part of their career, raising questions about the equity of research-related opportunities and education/awareness across communities prior to physician and graduate training.
This analysis found that, although physician scientists closely resemble the broader workforce in some ways, they are having different experiences than their nonresearch physician peers. Physician scientists are more highly exposed to mistreatment from their colleagues and work longer hours than physicians who are not engaged in research. This finding underscores the continued importance of improving the research environment and a need for resources like the Appropriate Treatment of Research Trainees guidelines recently released by the AAMC Group on Research, Education, and Training (GREAT).8 However, most physician scientists still reported career satisfaction, raising questions about work factors that may counterbalance and buffer against the daily challenges that physician scientists face.
References
- Garrison HH, Ley TJ. Physician-scientists in the United States at 2020: Trends and concerns. FASEB J. 2022 May;36(5):e22253. doi: 10.1096/fj.202200327.
- Andriole DA, Wolfson RK. The physician-investigator workforce: looking ahead. Acad Med. 2021;96(4):486. doi:10.1097/ACM.0000000000003944.
- Koenig RJ. New insights into an old question: can the MD-PhD physician-scientist pipeline be improved? JCI Insight. 2022;7(6):e158466. doi:10.1172/jci.insight.158466.
- Respondents were asked the following questions: “During a typical week, approximately what percent of your working time is spent in the following activities?” with “research” as one specified activity, and for those who indicated that they were involved in research: “You indicated that you spend time on research. Which of the following types of research do you do? (Please check all that apply.)”
- For this analysis, all respondents who indicated involvement in research are included as “physician scientists,” including those who may be more peripherally involved in research.
- In the 2022 NSSP, respondents were asked to report how frequently in the past year (never, once, 2-5 times, more than 5 times), by a coworker, they had: been threatened with physical harm; been physically harmed; been subject to unwanted sexual advances; been subjected to sexist remarks/names; been subjected to racially or ethnically offensive remarks/names; been subjected to offensive remarks/names related to sexual orientation; been subjected to offensive remarks/names related to a disability; and been subjected to offensive remarks/names based on personal beliefs.
- Boyle P. More women than men are enrolled in medical school. AAMCNews. https://www.aamc.org/news/more-women-men-are-enrolled-medical-school. Published online Dec. 9, 2019.Accessed June 26, 2023.
- Blake N, Brandt P, Corlew R, et al. Appropriate Treatment of Research Trainees. AAMC; 2021.
Author
Alyssa Browne, PhD
abrowne@aamc.org